

Question: Using Matlab Read in the given excel file and add two to every other y value. If the value of the new y value is
Using Matlab
Read in the given excel file and add two to every other y value. If the value of the new y value is above 50, set it to 50.
Plot the x column values against the new y column values.
Remember the x axis and y axis should be labeled. There needs to be a title on the graph as well
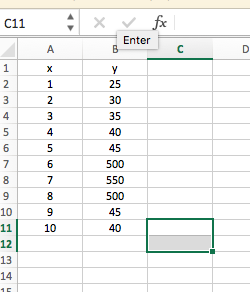
y 25 30 35 40 45 500 $50 500 45 40 9 x-23456789 10 123456789 y 25 30 35 40 45 500 $50 500 45 40 9 x-23456789 10 123456789
Step by Step Solution
There are 3 Steps involved in it
1 Expert Approved Answer
Step: 1 Unlock

Question Has Been Solved by an Expert!
Get step-by-step solutions from verified subject matter experts
Step: 2 Unlock
Step: 3 Unlock