

Question: using Matlab Simulate the Markov chain defined given by the probabilities shown in Figure 1.1 belovw 0.3 0.5 0.6 2 3 4 0.7 0.5 0.4
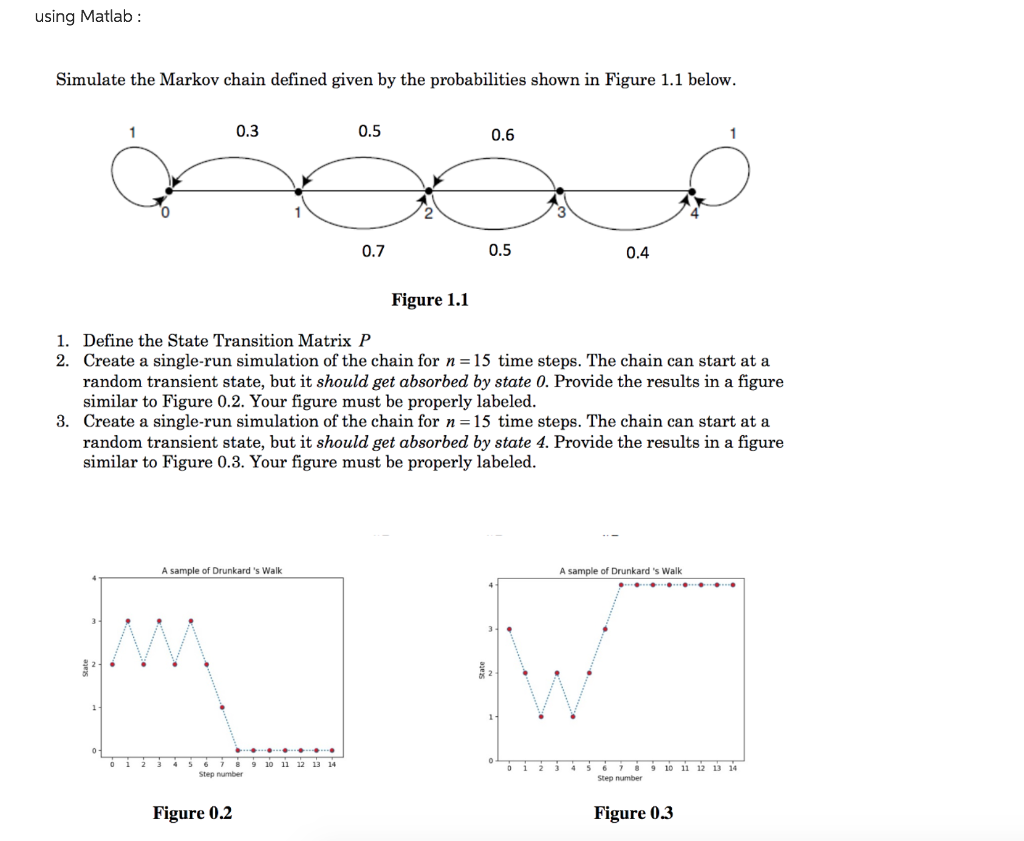
using Matlab Simulate the Markov chain defined given by the probabilities shown in Figure 1.1 belovw 0.3 0.5 0.6 2 3 4 0.7 0.5 0.4 Figure 1.1 1. Define the State Transition Matrix P 2. Create a single-run simulation of the chain for n-15 time steps. The chain can start at a random transient state, but it should get absorbed by state 0. Provide the results in a figure similar to Figure 0.2. Your figure must be properly labeled 3. Create a single-run simulation of the chain for n 15 time steps. The chain can start at a random transient state, but it should get absorbed by state 4. Provide the results in a figure similar to Figure 0.3. Your figure must be properly labeled A sample of Drunkard 's Walk A sample of Drunkard 's Walk 0 1 2 3 45 6789 10 11 12 13 14 Step number 0 1 2 3 4 5678 9 10 11 12 13 14 Step number Figure 0.2 Figure 0.3
Step by Step Solution
There are 3 Steps involved in it

Get step-by-step solutions from verified subject matter experts