

Question: Using MATLAB, take the data in the table above, plot it, and then use regression analysis to find a and b in the equation above
 Using MATLAB, take the data in the table above, plot it, and then use regression analysis to find a and b in the equation above
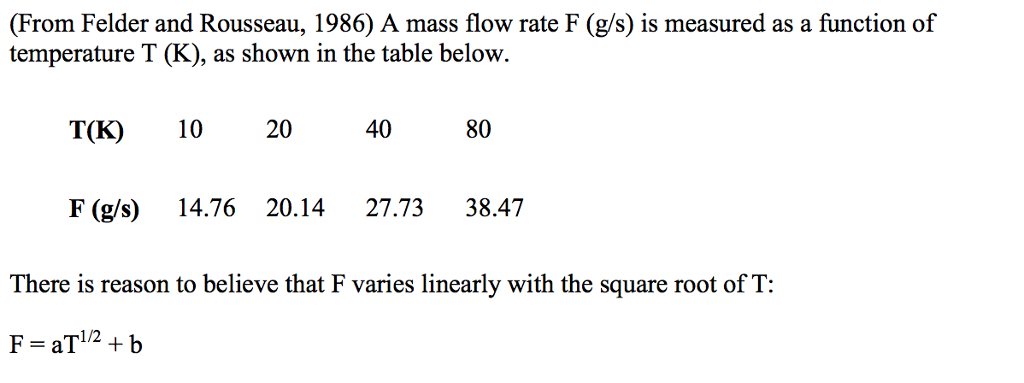
(From Felder and Rousseau, 1986) A mass flow rate F (g/s) is measured as a function of temperature T (K), as shown in the table below. T(K) 10 204080 F (g/s) 14.76 20.14 27.73 38.47 There is reason to believe that F varies linearly with the square root of T: 1/2
Step by Step Solution
There are 3 Steps involved in it
1 Expert Approved Answer
Step: 1 Unlock

Question Has Been Solved by an Expert!
Get step-by-step solutions from verified subject matter experts
Step: 2 Unlock
Step: 3 Unlock