

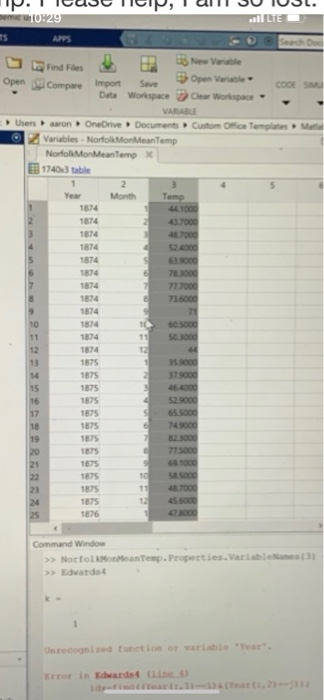
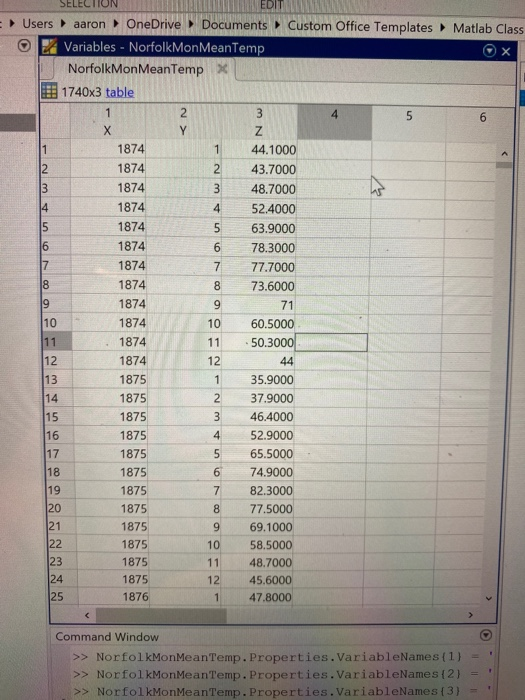
Question: using matlab the data is labeled Year, Month, Temp. this is what the imported data looks like X is year Y is month 1-12 Z
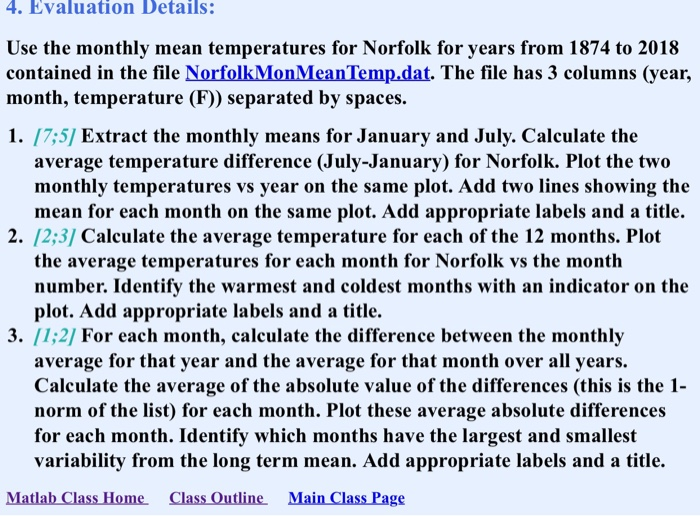
4. Evaluation Details: Use the monthly mean temperatures for Norfolk for years from 1874 to 2018 contained in the file NorfolkMonMean Temp.dat. The file has 3 columns (year, month, temperature (F)) separated by spaces. 1. [7:57 Extract the monthly means for January and July. Calculate the average temperature difference (July-January) for Norfolk. Plot the two monthly temperatures vs year on the same plot. Add two lines showing the mean for each month on the same plot. Add appropriate labels and a title. 2. 12;3] Calculate the average temperature for each of the 12 months. Plot the average temperatures for each month for Norfolk vs the month number. Identify the warmest and coldest months with an indicator on the plot. Add appropriate labels and a title. 3. [1:2] For each month, calculate the difference between the monthly average for that year and the average for that month over all years. Calculate the average of the absolute value of the differences (this is the 1- norm of the list) for each month. Plot these average absolute differences for each month. Identify which months have the largest and smallest variability from the long term mean. Add appropriate labels and a title. Matlab Class Home Class Outline Main Class Page P.IICUB NICIP, I ll 30 IUJL. 0:29 APPS Search Doe open compare import Seve Open Verb Data Workspace Clear Workspace VASE Users aaron OneDrive Documents Custom Orice Templates 2 Variables - NorfolMoneanTemp NorfolkMonMeanTempx 17403 table Month Temp 44.1000 Year 1874 1874 1874 47000 1874 78.3000 72.7000 1874 1874 1874 1874 60.5000 50.3000 35 000 1874 1875 1875 1875 1875 1875 46.4000 52.9000 65.5000 149000 1875 1875 775000 1875 1875 1875 1875 58SOOG 47000 45.6000 1875 1676 Command Window >> NorfolkoreanTemp. Properties. Variable >> Edwards Onrecognized function or wariable Year Error in Edwards Line) SELECTION MEDIT Users aaron OneDrive Documents Custom Office Templates Matlab Class Ex Variables - NorfolkMonMeanTemp NorfolkMonMeanTemp x 1740x3 table 44.1000 43.7000 48.7000 52.4000 63.9000 78.3000 77.7000 73.6000 71 10 11 1874 1874 1874 1874 1874 1874 1874 1874 1874 1874 1874 1874 1875 1875 1875 1875 1875 1875 1875 1875 1875 1875 1875 1875 1876 60.5000 50.3000 44 35.9000 37.9000 46.4000 52.9000 65.5000 74.9000 82.3000 77.5000 69.1000 58.5000 48.7000 45.6000 47.8000 12 Command Window >> NorfolkMonMean Temp. Properties. VariableNames (1) - >> NorfolkMonMean Temp. Properties. VariableNames (2) = >> NorfolkMonMean Temp. Properties. VariableNames (3) - 4. Evaluation Details: Use the monthly mean temperatures for Norfolk for years from 1874 to 2018 contained in the file NorfolkMonMean Temp.dat. The file has 3 columns (year, month, temperature (F)) separated by spaces. 1. [7:57 Extract the monthly means for January and July. Calculate the average temperature difference (July-January) for Norfolk. Plot the two monthly temperatures vs year on the same plot. Add two lines showing the mean for each month on the same plot. Add appropriate labels and a title. 2. 12;3] Calculate the average temperature for each of the 12 months. Plot the average temperatures for each month for Norfolk vs the month number. Identify the warmest and coldest months with an indicator on the plot. Add appropriate labels and a title. 3. [1:2] For each month, calculate the difference between the monthly average for that year and the average for that month over all years. Calculate the average of the absolute value of the differences (this is the 1- norm of the list) for each month. Plot these average absolute differences for each month. Identify which months have the largest and smallest variability from the long term mean. Add appropriate labels and a title. Matlab Class Home Class Outline Main Class Page P.IICUB NICIP, I ll 30 IUJL. 0:29 APPS Search Doe open compare import Seve Open Verb Data Workspace Clear Workspace VASE Users aaron OneDrive Documents Custom Orice Templates 2 Variables - NorfolMoneanTemp NorfolkMonMeanTempx 17403 table Month Temp 44.1000 Year 1874 1874 1874 47000 1874 78.3000 72.7000 1874 1874 1874 1874 60.5000 50.3000 35 000 1874 1875 1875 1875 1875 1875 46.4000 52.9000 65.5000 149000 1875 1875 775000 1875 1875 1875 1875 58SOOG 47000 45.6000 1875 1676 Command Window >> NorfolkoreanTemp. Properties. Variable >> Edwards Onrecognized function or wariable Year Error in Edwards Line) SELECTION MEDIT Users aaron OneDrive Documents Custom Office Templates Matlab Class Ex Variables - NorfolkMonMeanTemp NorfolkMonMeanTemp x 1740x3 table 44.1000 43.7000 48.7000 52.4000 63.9000 78.3000 77.7000 73.6000 71 10 11 1874 1874 1874 1874 1874 1874 1874 1874 1874 1874 1874 1874 1875 1875 1875 1875 1875 1875 1875 1875 1875 1875 1875 1875 1876 60.5000 50.3000 44 35.9000 37.9000 46.4000 52.9000 65.5000 74.9000 82.3000 77.5000 69.1000 58.5000 48.7000 45.6000 47.8000 12 Command Window >> NorfolkMonMean Temp. Properties. VariableNames (1) - >> NorfolkMonMean Temp. Properties. VariableNames (2) = >> NorfolkMonMean Temp. Properties. VariableNames (3)
Step by Step Solution
There are 3 Steps involved in it

Get step-by-step solutions from verified subject matter experts