

Question: Using MATLAB The step response of a certain dynamic system is described by the following function: x(t) 1-e cos(wat) 0.2eot sin(at) Plot this response for
 Using MATLAB
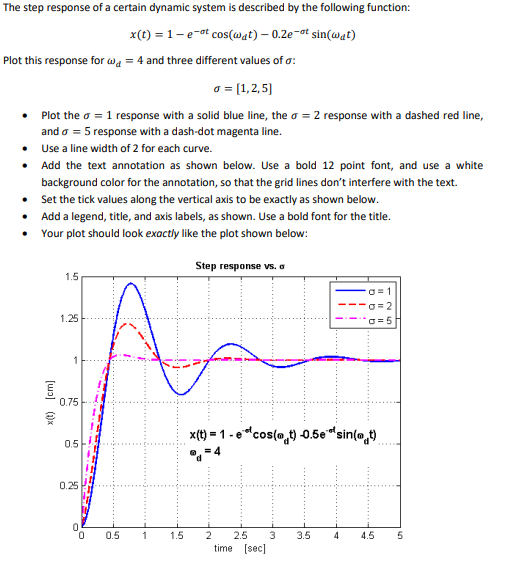
The step response of a certain dynamic system is described by the following function: x(t) 1-e cos(wat) 0.2eot sin(at) Plot this response for ua-4 and three different values of ?: Plot the ?-1 response with a solid blue line, the ?-2 response with a dashed red line, and ?-5 response with a dash-dot magenta line. Use a line width of 2 for each curve. .Add the text annotation as shown below. Use a bold 12 point font, and use a white background color for the annotation, so that the grid lines don't interfere with the text. . Set the tick values along the vertical axis to be exactly as shown below .Add a legend, title, and axis labels, as shown. Use a bold font for the title. Your plot should look exactly like the plot shown below: Step response vs. ? 1.25 0.75. -1-ecos(a 0.5 0.25 0 0.5 15 2 2.5 33.54.5 5 time [sec]
Step by Step Solution
There are 3 Steps involved in it

Get step-by-step solutions from verified subject matter experts