

Question: Using MATLAB to solve the question. EXAMPLE 2.8 % Example 2.8 ..... % +++++ Match Filter Receiver for PAM Signals +++++++ % (Note: This is
Using MATLAB to solve the question.
EXAMPLE 2.8
% Example 2.8 ..... % +++++ Match Filter Receiver for PAM Signals +++++++ % (Note: This is a digital simulation of the analog receiver) % For analog representation the Bit period, T is selected as 100 samples. % ----------------------------------------
clear all ; close all;
s1 = 3*ones(1,100) ; % Transmitted signal s1 s0 = -3*ones(1,100) ; % Transmitted signal s0
hh = 3*ones(1,100) ; % impulse response
xx = [0:101] ; figure(1); subplot(3,1,1); plot(xx,[0 s0 0]) ; axis([-50 150 -4 4]); grid; title('Transmitted Signal for bit=0'); subplot(3,1,2); plot(xx,[0 s1 0]) ; axis([-50 150 -4 4]); grid; title('Transmitted Signal for bit=1'); subplot(3,1,3); plot(xx,[0 hh 0]) ; axis([-50 150 -4 4]); grid; title('Matched Filter'); xlabel('Time (in arbitrary units)');
r0 = conv(s0, hh); % correlation between bit=0 received signal & pulse shape r1 = conv(s1, hh); % correlation between bit=1 received signal & pulse shape xx2 = [0:198]; figure(2); subplot(2,1,1); plot(xx2,r0,[100 100],[-1000 1000],'r--') ; axis([-50 250 -1000 1000]); grid; title('Matched Filter output for bit=0'); subplot(2,1,2); plot(xx2,r1,[100 100],[-1000 1000],'r--') ; axis([-50 250 -1000 1000]); grid; title('Matched Filter output for bit=1');
---------------------------------------------------------------
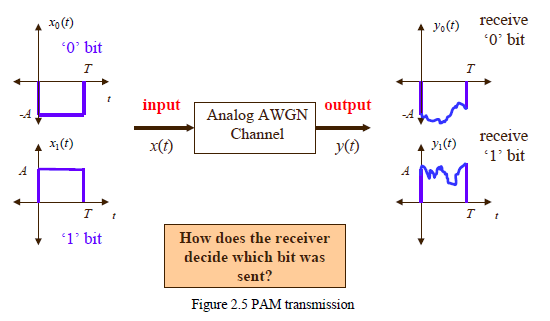
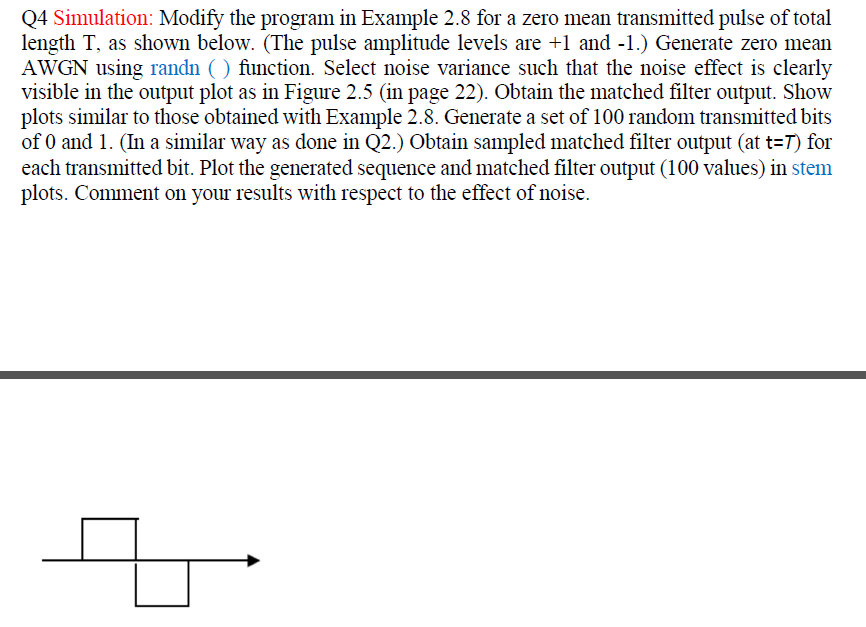
Q4 Simulation: Modify the program in Example 2.8 for a zero mean transmitted pulse of total length T, as shown below. (The pulse amplitude levels are +1 and -1.) Generate zero mean AWGN using randn() function. Select noise variance such that the noise effect is clearly visible in the output plot as in Figure 2.5 (in page 22). Obtain the matched filter output. Show plots similar to those obtained with Example 2.8. Generate a set of 100 random transmitted bits of 0 and 1. (In a similar way as done in Q2.) Obtain sampled matched filter output (at t=T) for each transmitted bit. Plot the generated sequence and matched filter output (100 values) in stem plots. Comment on your results with respect to the effect of noise. yo(t) xo() 'O' bit T receive 'O' bit T input output Analog AWGN Channel y(t) y(t) receive '1' bit 4 cm? T t T 1 '1' bit How does the receiver decide which bit was sent? Figure 2.5 PAM transmission Q4 Simulation: Modify the program in Example 2.8 for a zero mean transmitted pulse of total length T, as shown below. (The pulse amplitude levels are +1 and -1.) Generate zero mean AWGN using randn() function. Select noise variance such that the noise effect is clearly visible in the output plot as in Figure 2.5 (in page 22). Obtain the matched filter output. Show plots similar to those obtained with Example 2.8. Generate a set of 100 random transmitted bits of 0 and 1. (In a similar way as done in Q2.) Obtain sampled matched filter output (at t=T) for each transmitted bit. Plot the generated sequence and matched filter output (100 values) in stem plots. Comment on your results with respect to the effect of noise. yo(t) xo() 'O' bit T receive 'O' bit T input output Analog AWGN Channel y(t) y(t) receive '1' bit 4 cm? T t T 1 '1' bit How does the receiver decide which bit was sent? Figure 2.5 PAM transmission
Step by Step Solution
There are 3 Steps involved in it

Get step-by-step solutions from verified subject matter experts