

Question: Using matlab You have been asked to do some basic analysis of the monthly production data for a manufacturing company In the given data set,
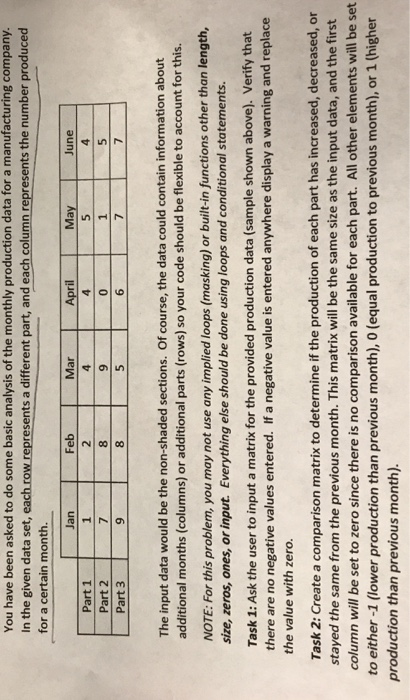
You have been asked to do some basic analysis of the monthly production data for a manufacturing company In the given data set, each.row represents a different part, and each column represents the number produced for a certain month. Feb May Mar 4 Jan June Part 1 Part 2 Part 3 1 The input data would be the non-shaded sections. Of course, the data could contain information about additional months (columns) or additional parts (rows) so your code should be flexible to account for this. NOTE: For this problem, you may not use any implied loops (masking) or built-in functions other than length, size, zeros, ones, or input. Everything else should be done using loops and conditional statements. Task 1: Ask the user to input a matrix for the provided production data (sample shown above). Verify that there are no negative values entered. If a negative value is entered anywhere display a warning and replace the value with zero. Task 2: Create a comparison matrix to determine if the production of each part has increased, decreased, or stayed the same from the previous month. This matrix will be the same size as the input data, and the first column will be set to zero since there is no comparison available for each part. All other elements will be set to either -1 (lower production than previous month), O (equal production to previous month), or 1 (higher production than previous month)
Step by Step Solution
There are 3 Steps involved in it

Get step-by-step solutions from verified subject matter experts