

Question: Using Matlab/Octave, 1) write the code to clear the command window 2) write the code to close all previous figures 3) write the code to
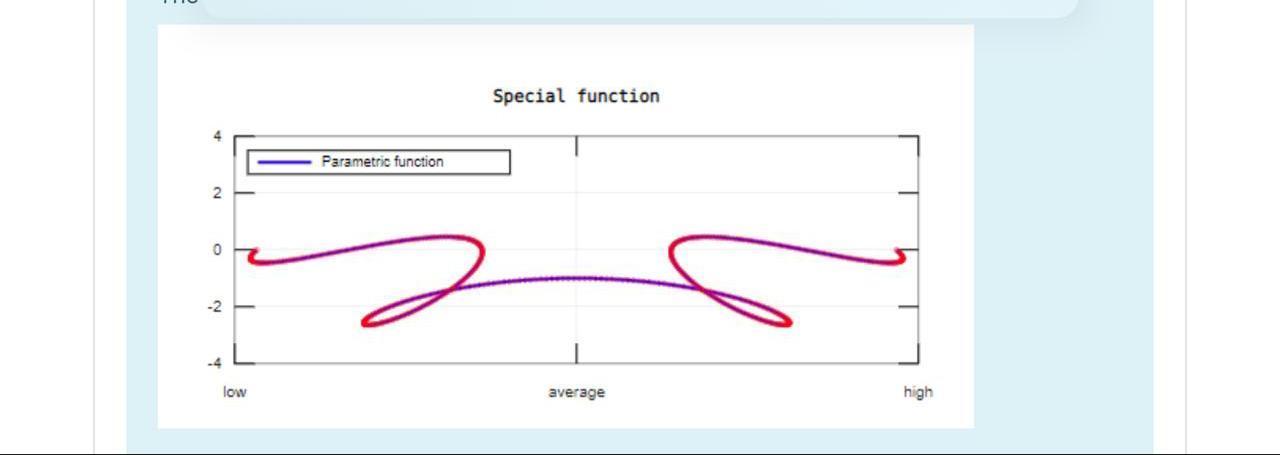
Using Matlab/Octave, 1) write the code to clear the command window 2) write the code to close all previous figures 3) write the code to clear all previous parameters 4) Divide the figure on 2 subfigures (2 rows) and put the target graph of function in the second subfigure 5) write a vector t that containing elements from -2 to 2 with length 500. 6) compute the vectors x = sin(4t) + 2 sin(t) and y = cos(5t) - 2cos(t) 6) Sketch the function y(x). 7) Choose the color blue of the function and the width for line 2 and choose marker as o with size 1 and with marker edge color red. 8) Put a title as: Graph of Special function 9) adjust the axis limit the x axis from -3 to 3 and y axis from -4 to 4 The result must be similar to: Special function Parametric function 2 0 -2 .4 low average high
Step by Step Solution
There are 3 Steps involved in it

Get step-by-step solutions from verified subject matter experts