

Question: Using Matlabs. Upload your scripts. Comment each section 2. Below you will find three different sets of data (a, b, and c). For each data
Using Matlabs. Upload your scripts. Comment each section
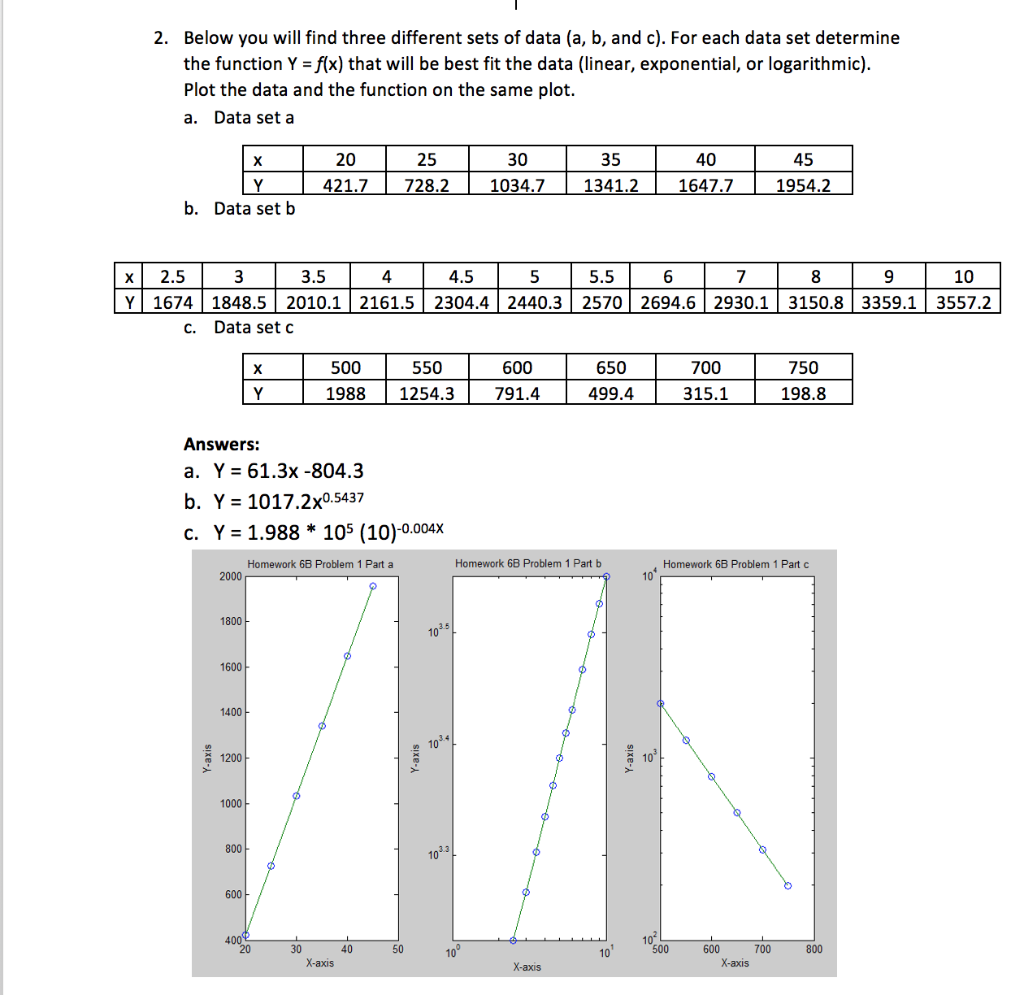
2. Below you will find three different sets of data (a, b, and c). For each data set determine the function Y = f(x) that will be best fit the data (linear, exponential, or logarithmic). Plot the data and the function on the same plot. a. Data set a x 20 25 | 421.7 | 728.2 b. Data set b 30 1034.7 35 40 45 1341.21 1647.7 | 1954.2 x 2.5 3 3.5 4 4.5 5 5.5 6 7 8 9 10 Y| 1674 1848.5 2010. 12161. 52304.4 2440. 32570 2694.6 2930.1 3150.8 3359.1 3557.2 C. Data setc x 500 550 600 650 700 750 Y 1988 1254.3 791. 4 4 99.4 315.1 198.8 Answers: a. Y = 61.3x -804.3 b. Y = 1017.2x0.5437 c. Y = 1.988 * 105 (10)-0.004X Homework 6B Problem 1 Part b Homework 68 Problem 1 Part Homework 68 Problem 1 Part a 2000 1800 1600 1400 Y-axis 1200 Y-axis Y-axis 10 1000 800 600 400 4020 50 1024 500 30 40 X-axis 100 10 700 800 600 X-axis X-axis
Step by Step Solution
There are 3 Steps involved in it

Get step-by-step solutions from verified subject matter experts