

Question: Using matlab. upload your scripts and screenshot Please comment on the code to help me understand 5. (5 points) Fit the following data using the
Using matlab. upload your scripts and screenshot
Please comment on the code to help me understand
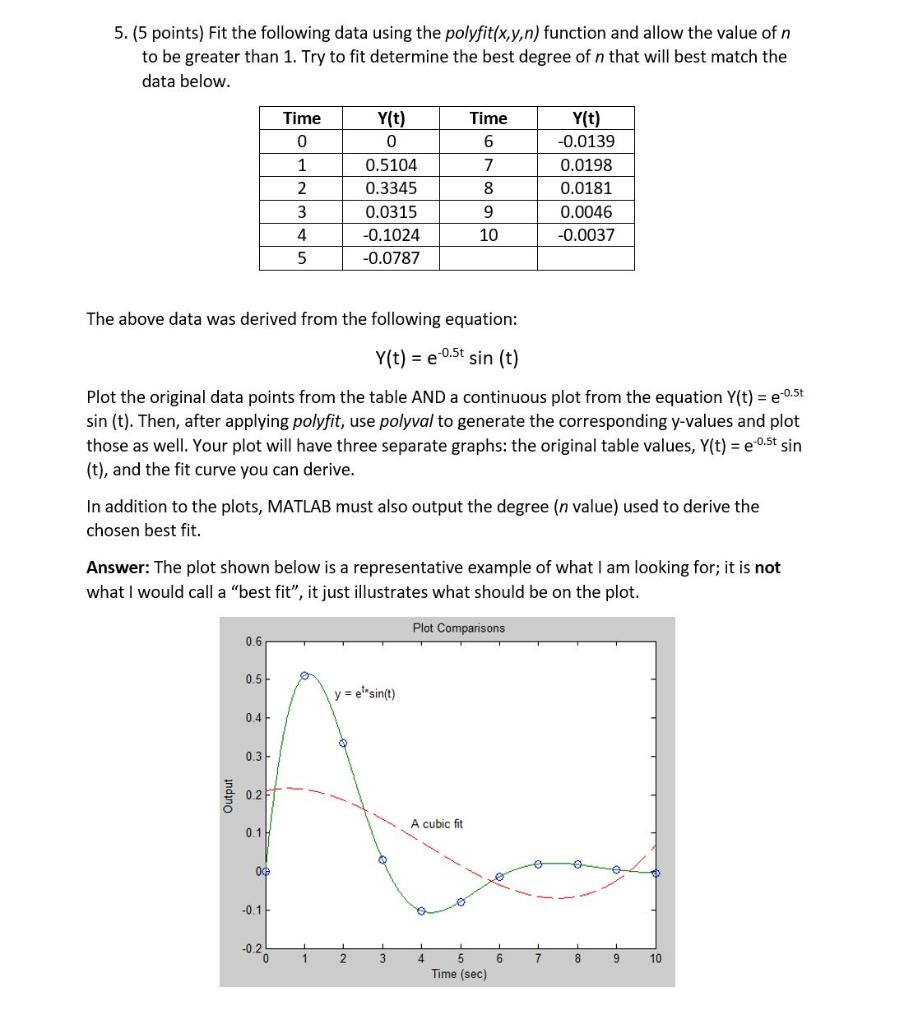
5. (5 points) Fit the following data using the polyfit(x,y,n) function and allow the value of n to be greater than 1. Try to fit determine the best degree of n that will best match the data below. Time 6 Time 0 1 2 3 Y(t) 0 0.5104 0.3345 0.0315 -0.1024 -0.0787 7 8 Y(t) -0.0139 0.0198 0.0181 0.0046 -0.0037 9 4 10 5 The above data was derived from the following equation: Y(t) = e 0.5t sin (t) Plot the original data points from the table AND a continuous plot from the equation y(t) = e:0.5t sin (t). Then, after applying polyfit, use polyval to generate the corresponding y-values and plot those as well. Your plot will have three separate graphs: the original table values, y(t) = e 0.5t sin (t), and the fit curve you can derive. In addition to the plots, MATLAB must also output the degree (n value) used to derive the chosen best fit. Answer: The plot shown below is a representative example of what I am looking for; it is not what I would call a "best fit, it just illustrates what should be on the plot. Plot Comparisons 0.6 0.5 y = esin(t) 0.4 0.3 Output 0.2 FT A cubic fit 0.1 00 e -0.1 -02 1 2 3 4 6 7 8 9 10 5 Time (sec)
Step by Step Solution
There are 3 Steps involved in it

Get step-by-step solutions from verified subject matter experts