

Question: Using Microsoft Corporation's 2018 financial statements: a. Compute net operating profit after tax (NOPAT) for 2018 and 2017. Assume that combined federal and state statutory
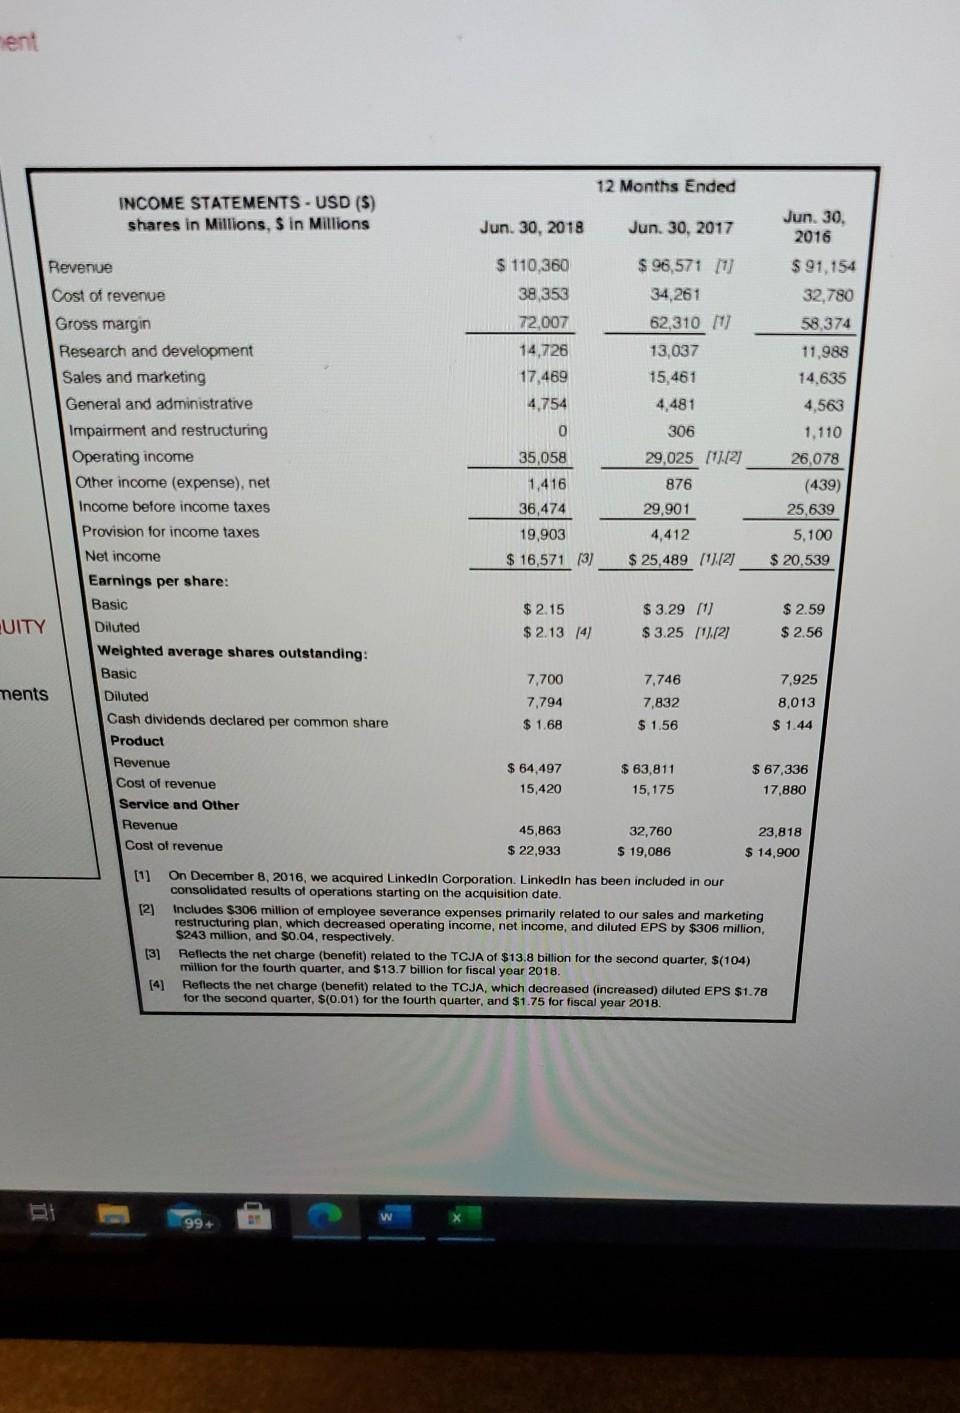
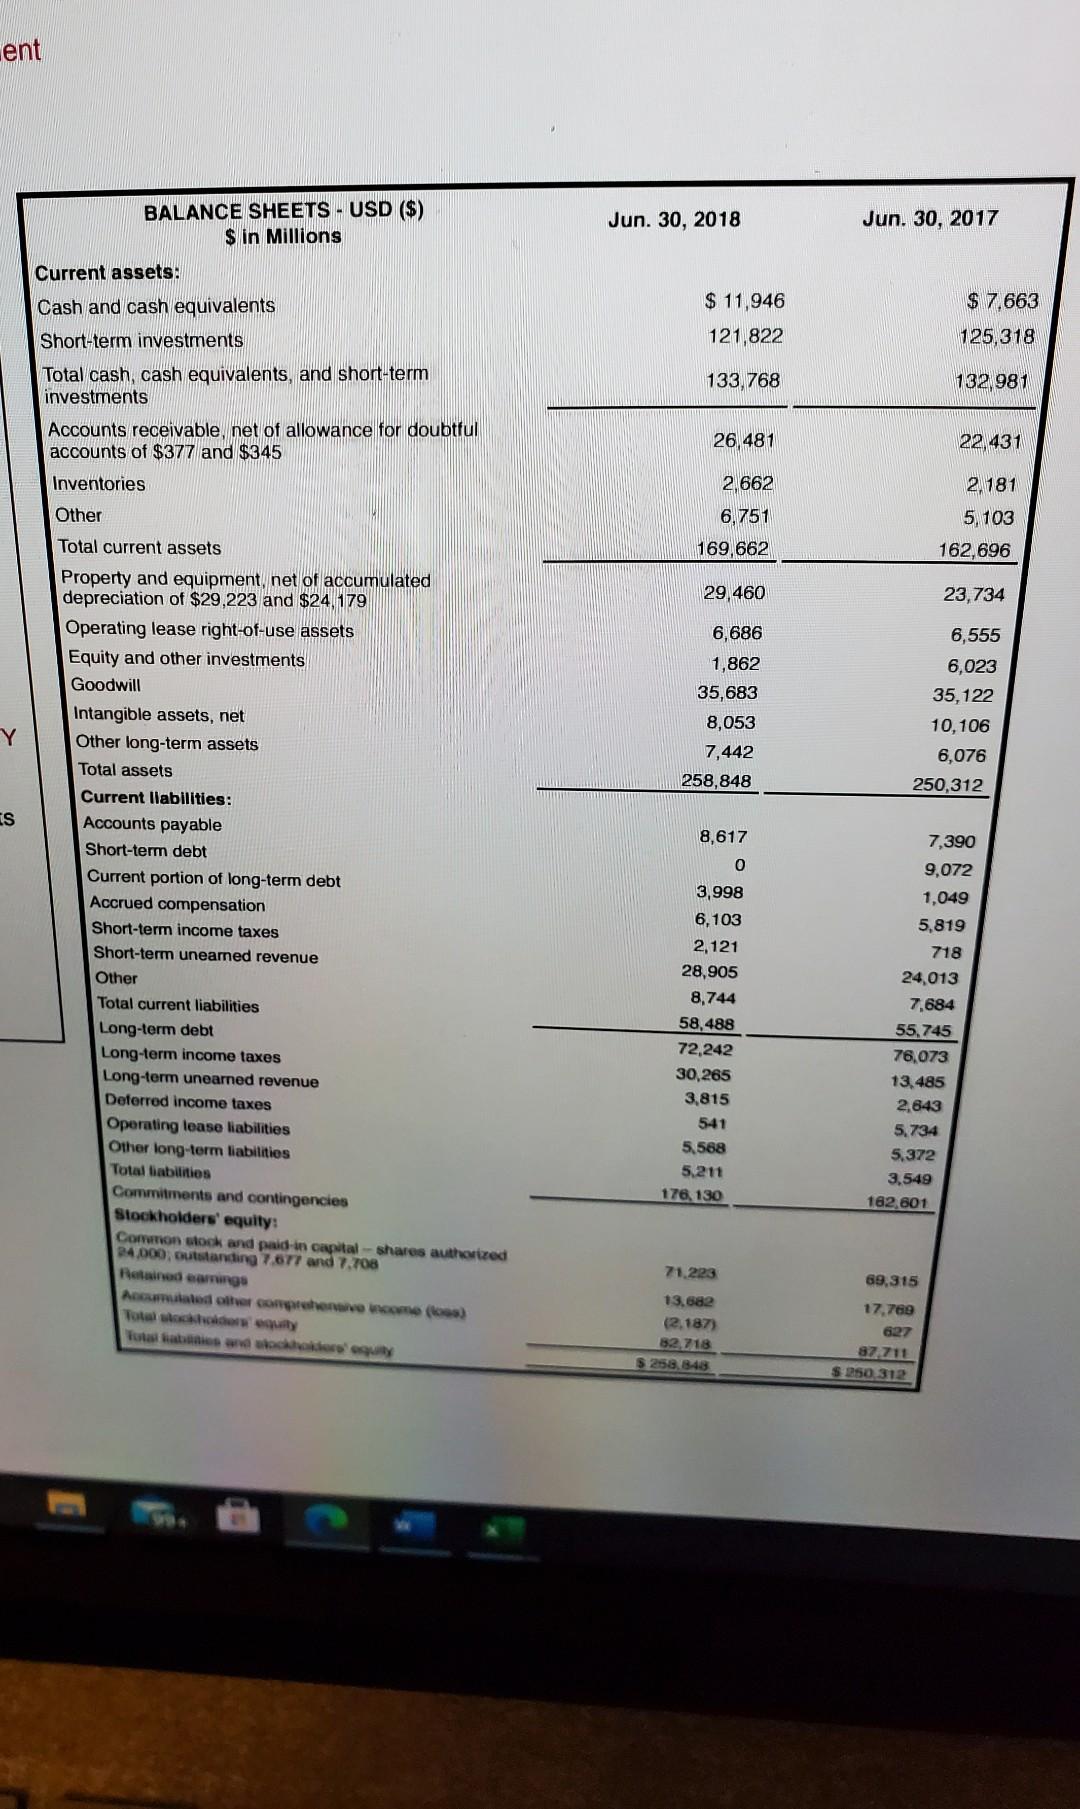
Using Microsoft Corporation's 2018 financial statements: a. Compute net operating profit after tax (NOPAT) for 2018 and 2017. Assume that combined federal and state statutory tax rates are 21% for both yea b. Compute net operating assets (NOA) for 2018 and 2017. Assume Equity and other investments are operating assets. C. Compute return on net operating assets (RNOA) for 2018 and 2017. Net operating assets are $12,444 million in 2016. d. Compute return on equity (ROE) for 2018 and 2017. (Stockholders' equity in 2016 is $71,997 million.) e. Comment on the difference between ROE and RNOA. What inference do you draw from this comparison? For the toolbar, press ALT+F10 (PC) or ALT+FN+F10 (Mac). B I V S Paragraph Arial 14px 2% w Ei 99+ Poup Prisen FC ment 12 Months Ended INCOME STATEMENTS - USD ($) shares in Millions, S in Millions Jun 30, 2018 Jun 30, 2017 Jun 30, 2016 $ 96,571 11 34,261 62,310 / $ 110,360 38,353 72,007 14,726 17.469 4.754 $ 91,154 32,780 58,374 11,988 14.635 0 13,037 15,461 4,481 306 29,025 [2] 876 29,901 Revenue Cost of revenue Gross margin Research and development Sales and marketing General and administrative Impairment and restructuring Operating income Other income (expense), net Income before income taxes Provision for income taxes Net income Earnings per share: Basic UITY Diluted Weighted average shares outstanding: Basic ments Diluted Cash dividends declared per common share Product Revenue Cost of revenue Service and Other Revenue 4,563 1,110 26,078 (439) 25,639 5,100 35,058 1,416 36,474 19,903 $ 16,571 (3) 4,412 $ 25,489 (112) $ 20,539 $ 2.15 $ 2.13 (4) $ 3.29 (1 $ 3.25 0.[2] $ 2.59 $ 2.56 7,700 7,746 7,925 7,794 $ 1.68 7,832 $ 1.56 8,013 $ 1.44 $ 64,497 15,420 $ 63,811 15,175 $ 67,336 17,880 45,863 Cost of revenue 32,760 $ 19,086 23,818 $ 14,900 $ 22,933 On December 8, 2016, we acquired LinkedIn Corporation Linkedin has been included in our consolidated results of operations starting on the acquisition date. [2] Includes $306 million of employee severance expenses primarily related to our sales and marketing restructuring plan, which decreased operating income, net income, and diluted EPS by $306 million, $243 million, and S0.04, respectively. (3) Reflects the net charge (benefit) related to the TCJA of $13.8 billion for the second quarter, $(104) million for the fourth quarter, and $13.7 billion for fiscal year 2018. [4] Reflects the net charge (benefit) related to the TCJA, which decreased (increased) diluted EPS $1.78 for the second quarter, S(0.01) for the fourth quarter, and $1.75 for fiscal year 2018 BE 994 ent BALANCE SHEETS - USD ($) $ in Millions Jun. 30, 2018 Jun. 30, 2017 $ 11,946 121,822 $ 7.663 125,318 Current assets: Cash and cash equivalents Short-term investments Total cash, cash equivalents, and short-term investments Accounts receivable net of allowance for doubtful accounts of $377 and $345 Inventories 133,768 132 981 26,481 22 431 2.662 6,751 169,662 2,181 5,103 Other 162, 696 29 460 23,734 6,686 1,862 35,683 8,053 7,442 258,848 6,555 6,023 35,122 10,106 6,076 250,312 IS 8,617 7,390 9,072 1,049 Total current assets Property and equipment net of accumulated depreciation of $29,223 and $24. 179 Operating lease right-of-use assets Equity and other investments Goodwill Intangible assets, net Other long-term assets Total assets Current llabilities: Accounts payable Short-term debt Current portion of long-term debt Accrued compensation Short-term income taxes Short-term uneared revenue Other Total current liabilities Long-term debt Long-term income taxes Long-term unearned revenue Deferred income taxes Operating lease liabilities Other long-term liabilities Total liabilities Commitments and contingencies Stockholders' equity Common stock and paid in capital -- shares authorized 24.000, outstanding 7677 and 7.708 Retained ang Aaaaaaionaroo ( ) 0 3,998 6,103 2,121 28,905 8,744 58,488 72,242 30.265 3.815 541 5,568 5.211 176, 130 5,819 718 24,013 7,684 55,745 76,073 13,485 2,843 5,734 5.372 3,549 182,601 71.223 69,315 13.682 (2.187) 82,718 $ 258.848 17.769 627 87 711 $ 250 312 Using Microsoft Corporation's 2018 financial statements: a. Compute net operating profit after tax (NOPAT) for 2018 and 2017. Assume that combined federal and state statutory tax rates are 21% for both yea b. Compute net operating assets (NOA) for 2018 and 2017. Assume Equity and other investments are operating assets. C. Compute return on net operating assets (RNOA) for 2018 and 2017. Net operating assets are $12,444 million in 2016. d. Compute return on equity (ROE) for 2018 and 2017. (Stockholders' equity in 2016 is $71,997 million.) e. Comment on the difference between ROE and RNOA. What inference do you draw from this comparison? For the toolbar, press ALT+F10 (PC) or ALT+FN+F10 (Mac). B I V S Paragraph Arial 14px 2% w Ei 99+ Poup Prisen FC ment 12 Months Ended INCOME STATEMENTS - USD ($) shares in Millions, S in Millions Jun 30, 2018 Jun 30, 2017 Jun 30, 2016 $ 96,571 11 34,261 62,310 / $ 110,360 38,353 72,007 14,726 17.469 4.754 $ 91,154 32,780 58,374 11,988 14.635 0 13,037 15,461 4,481 306 29,025 [2] 876 29,901 Revenue Cost of revenue Gross margin Research and development Sales and marketing General and administrative Impairment and restructuring Operating income Other income (expense), net Income before income taxes Provision for income taxes Net income Earnings per share: Basic UITY Diluted Weighted average shares outstanding: Basic ments Diluted Cash dividends declared per common share Product Revenue Cost of revenue Service and Other Revenue 4,563 1,110 26,078 (439) 25,639 5,100 35,058 1,416 36,474 19,903 $ 16,571 (3) 4,412 $ 25,489 (112) $ 20,539 $ 2.15 $ 2.13 (4) $ 3.29 (1 $ 3.25 0.[2] $ 2.59 $ 2.56 7,700 7,746 7,925 7,794 $ 1.68 7,832 $ 1.56 8,013 $ 1.44 $ 64,497 15,420 $ 63,811 15,175 $ 67,336 17,880 45,863 Cost of revenue 32,760 $ 19,086 23,818 $ 14,900 $ 22,933 On December 8, 2016, we acquired LinkedIn Corporation Linkedin has been included in our consolidated results of operations starting on the acquisition date. [2] Includes $306 million of employee severance expenses primarily related to our sales and marketing restructuring plan, which decreased operating income, net income, and diluted EPS by $306 million, $243 million, and S0.04, respectively. (3) Reflects the net charge (benefit) related to the TCJA of $13.8 billion for the second quarter, $(104) million for the fourth quarter, and $13.7 billion for fiscal year 2018. [4] Reflects the net charge (benefit) related to the TCJA, which decreased (increased) diluted EPS $1.78 for the second quarter, S(0.01) for the fourth quarter, and $1.75 for fiscal year 2018 BE 994 ent BALANCE SHEETS - USD ($) $ in Millions Jun. 30, 2018 Jun. 30, 2017 $ 11,946 121,822 $ 7.663 125,318 Current assets: Cash and cash equivalents Short-term investments Total cash, cash equivalents, and short-term investments Accounts receivable net of allowance for doubtful accounts of $377 and $345 Inventories 133,768 132 981 26,481 22 431 2.662 6,751 169,662 2,181 5,103 Other 162, 696 29 460 23,734 6,686 1,862 35,683 8,053 7,442 258,848 6,555 6,023 35,122 10,106 6,076 250,312 IS 8,617 7,390 9,072 1,049 Total current assets Property and equipment net of accumulated depreciation of $29,223 and $24. 179 Operating lease right-of-use assets Equity and other investments Goodwill Intangible assets, net Other long-term assets Total assets Current llabilities: Accounts payable Short-term debt Current portion of long-term debt Accrued compensation Short-term income taxes Short-term uneared revenue Other Total current liabilities Long-term debt Long-term income taxes Long-term unearned revenue Deferred income taxes Operating lease liabilities Other long-term liabilities Total liabilities Commitments and contingencies Stockholders' equity Common stock and paid in capital -- shares authorized 24.000, outstanding 7677 and 7.708 Retained ang Aaaaaaionaroo ( ) 0 3,998 6,103 2,121 28,905 8,744 58,488 72,242 30.265 3.815 541 5,568 5.211 176, 130 5,819 718 24,013 7,684 55,745 76,073 13,485 2,843 5,734 5.372 3,549 182,601 71.223 69,315 13.682 (2.187) 82,718 $ 258.848 17.769 627 87 711 $ 250 312
Step by Step Solution
There are 3 Steps involved in it

Get step-by-step solutions from verified subject matter experts