Question: Using Microsoft Excel, calculate the hospital's Collection Period ratio, Average Collection Period ratio, Operating Margin ratio, Inventory Turnover Ratio using the Balance Sheet and Statement
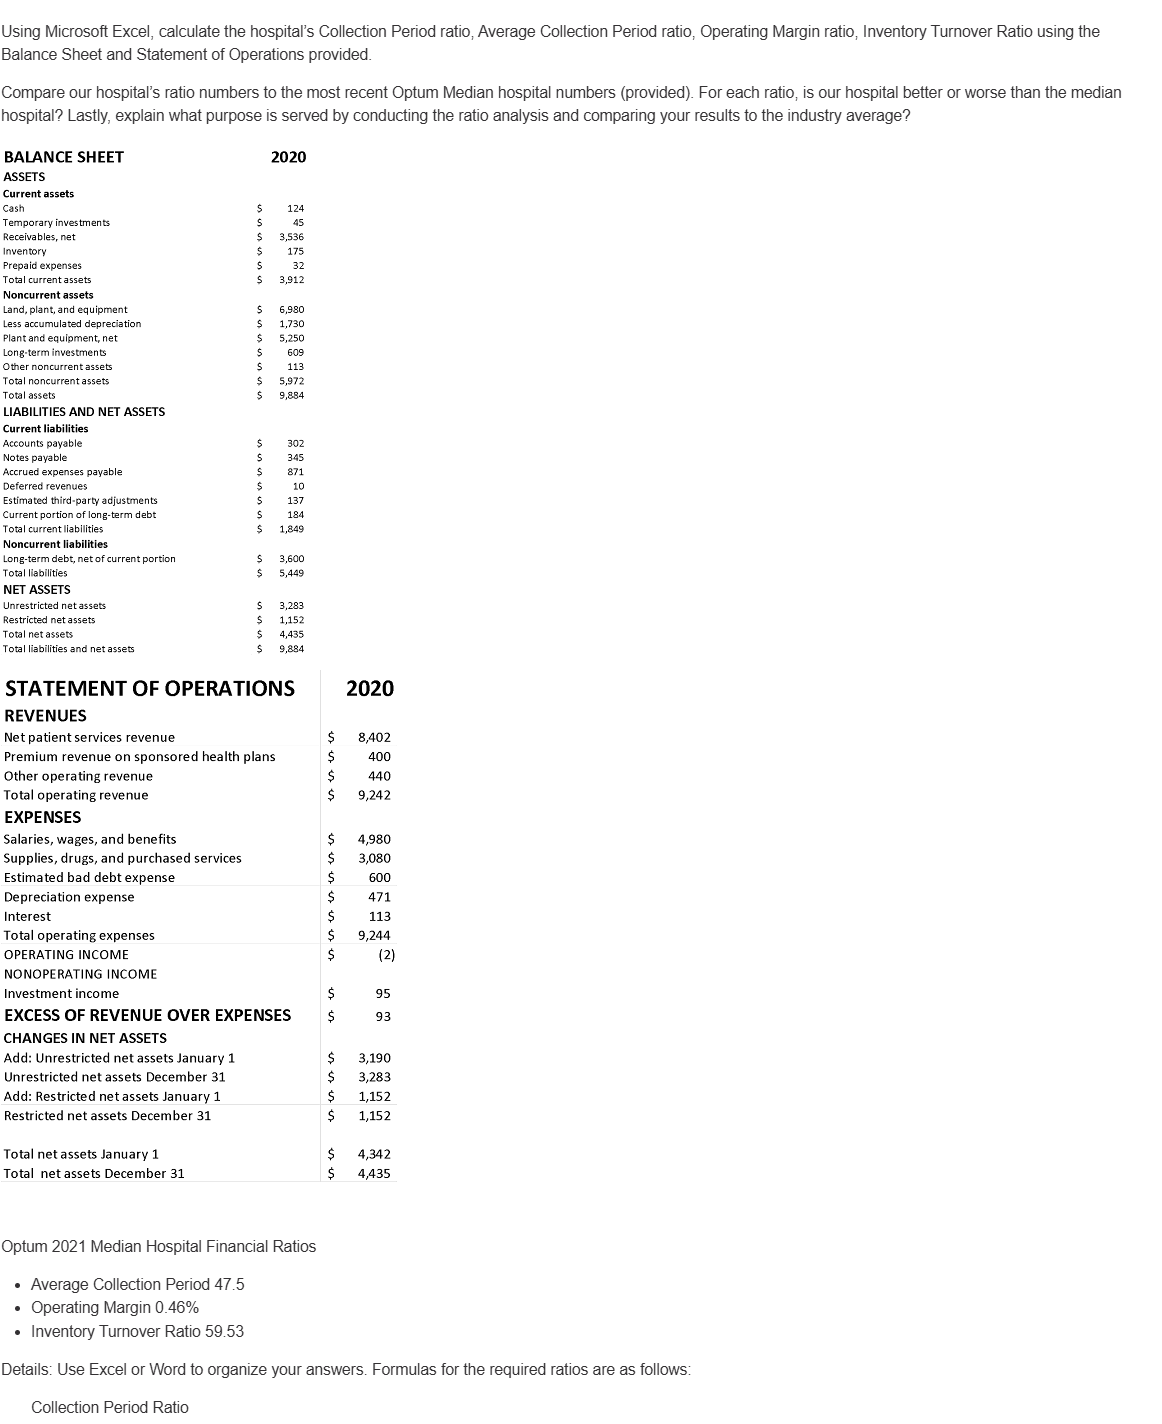
Using Microsoft Excel, calculate the hospital's Collection Period ratio, Average Collection Period ratio, Operating Margin ratio, Inventory Turnover Ratio using the Balance Sheet and Statement of Operations provided. Compare our hospital's ratio numbers to the most recent Optum Median hospital numbers (provided). For each ratio, is our hospital better or worse than the median hospital? Lastly, explain what purpose is served by conducting the ratio analysis and comparing your results to the industry average? BALANCE SHEET 2020 ASSETS. Current assets Cash $ 124 Temporary investments 5 a5 Receivables, net S 3,536 Inventory $ 17S Prepaid expenses 5 32 Total current assets S$ 3,912 Noncurrent assets Land, plant,and equipment 5 6,980 Less accumulated depreciation S 1,730 Plant and equipment, net $ 5,250 Long-term investments 5 609 Other noncurrent assets 5 113 Total noncurrent assets S$ 5,972 Total assets $ 9,884 LIABILITIES AND NET ASSETS Current liabilities Accounts payable 3 302 Notes payable 5 B45 Accrued expenses payable 5 ar. Deferred revenues $ 10 Estimated third-party adjustments $ 137 Current portion of long-term debt 5 184 Total current llabilities S 1,849 Noncurrent liabilities Long-term debt, net of current portion S 3,600 Total liabilities $ 5,449 NET ASSETS Unrestricted net assets S$ 3,283 Restricted net assets S 1,152 Total netassets $ 4,485 Total liabilities and net assets 5 $884 STATEMENT OF OPERATIONS 2020 REVENUES Net patient services revenue $ 8,402 Premium revenue on sponsored health plans 5 400 Other operating revenue $ 440 Total operating revenue 5 9,242 EXPENSES Salaries, wages, and benefits S 4,980 Supplies, drugs, and purchased services $ 3,080 Estimated bad debt expense s 600 Depreciation expense 5 471 Interest s 113 Total operating expenses $ 9,244 OPERATING INCOME $ (2) NONOPERATING INCOME Investment income s 95 EXCESS OF REVENUE OVER EXPENSES 93 CHANGES IN NET ASSETS Add: Unrestricted net assets January 1 S$ 3,190 Unrestricted net assets December 31 S$ 3,283 Add: Restricted net assets January 1 s 1,152 Restricted net assets December 31 1,152 Total netassets January 1 5S 4,342 Total net assets December 31 4,435 Optum 2021 Median Hospital Financial Ratios e Average Collection Period 47.5 e Operating Margin 0.46% e Inventory Turnover Ratio 59.53 Details: Use Excel or Word to organize your answers. Formulas for the required ratios are as follows: Collection Period Ratio
Step by Step Solution
There are 3 Steps involved in it
1 Expert Approved Answer
Step: 1 Unlock
Question Has Been Solved by an Expert!
Get step-by-step solutions from verified subject matter experts
Step: 2 Unlock
Step: 3 Unlock
Students Have Also Explored These Related Accounting Questions!