

Question: Using Microsoft Word or Google Documents you are to create a visual representation (Graph) of a standard product life cycle just like below Sales
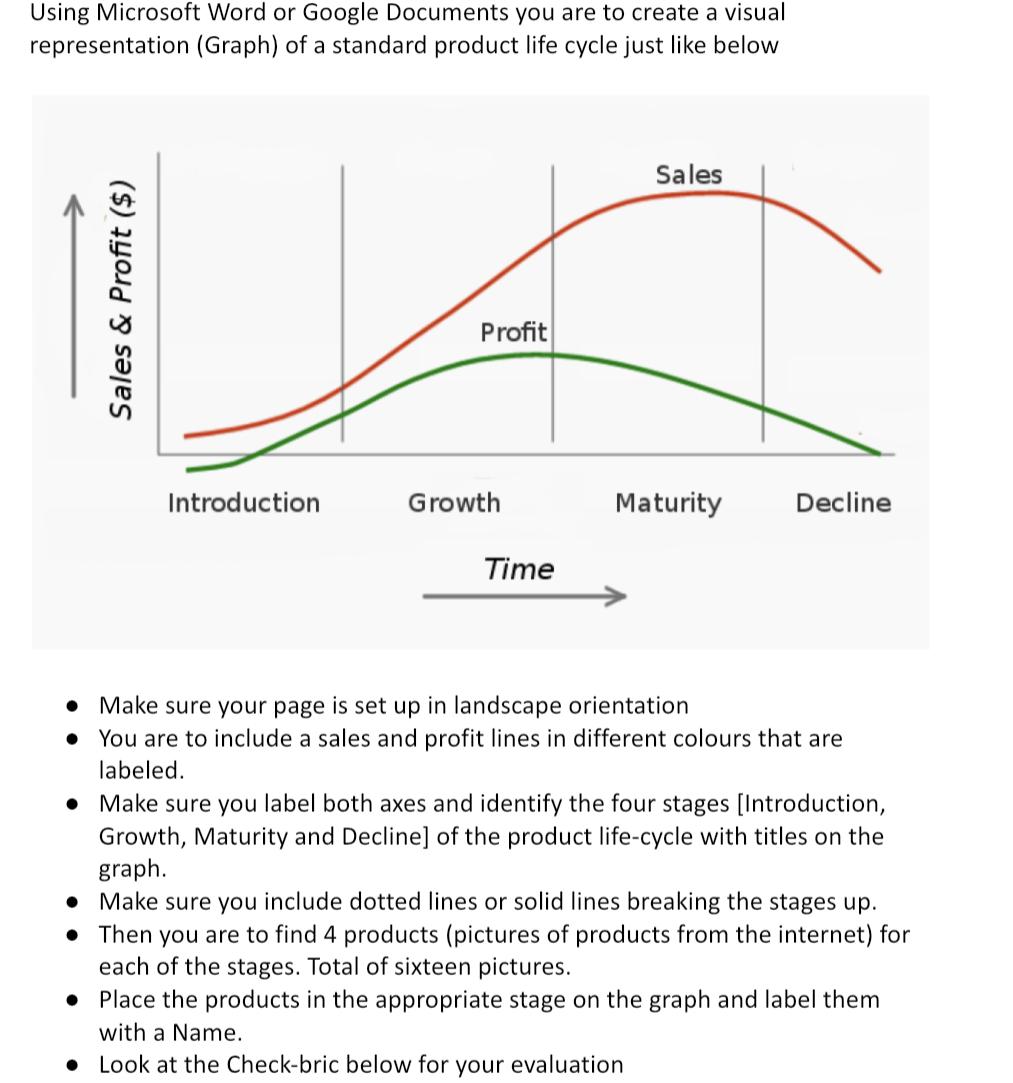
Using Microsoft Word or Google Documents you are to create a visual representation (Graph) of a standard product life cycle just like below Sales & Profit ($) Profit Sales Introduction Growth Maturity Decline Time Make sure your page is set up in landscape orientation You are to include a sales and profit lines in different colours that are labeled. Make sure you label both axes and identify the four stages [Introduction, Growth, Maturity and Decline] of the product life-cycle with titles on the graph. Make sure you include dotted lines or solid lines breaking the stages up. Then you are to find 4 products (pictures of products from the internet) for each of the stages. Total of sixteen pictures. Place the products in the appropriate stage on the graph and label them with a Name. Look at the Check-bric below for your evaluation
Step by Step Solution
There are 3 Steps involved in it

Get step-by-step solutions from verified subject matter experts