

Question: Using MS Excel or Google Sheets, a) compute the correlation coefficient, b) interpret the computed correlation coefficient, and c) plot the scatter diagram. 2. A
Using MS Excel or Google Sheets, a) compute the correlation coefficient, b) interpret the computed correlation coefficient, and c) plot the scatter diagram.
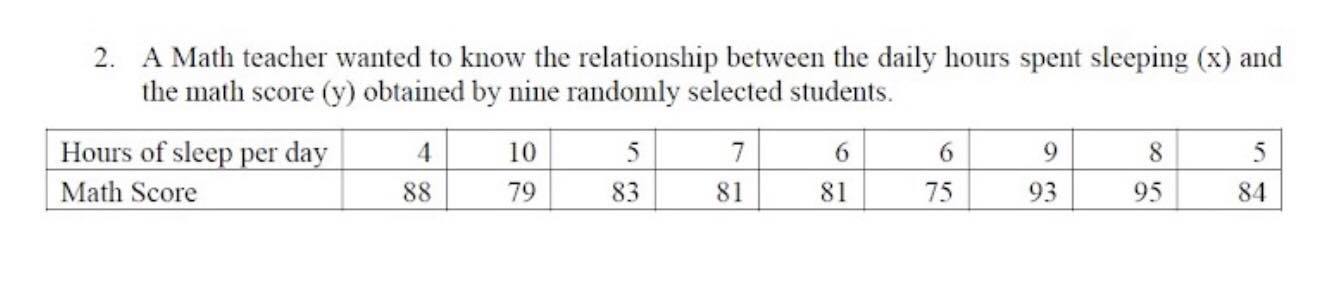
2. A Math teacher wanted to know the relationship between the daily hours spent sleeping (x) and the math score (y) obtained by nine randomly selected students. Hours of sleep per day A 10 5 7 6 6 9 8 5 Math Score 88 79 83 81 81 75 93 95 84
Step by Step Solution
There are 3 Steps involved in it
1 Expert Approved Answer
Step: 1 Unlock

Question Has Been Solved by an Expert!
Get step-by-step solutions from verified subject matter experts
Step: 2 Unlock
Step: 3 Unlock