

Question: Using Multiple Regression Results to Construct and Apply a Cost Formula The controller for McGarvey Manufacturing Company felt that the number of purchase orders alone
Using Multiple Regression Results to Construct and Apply a Cost Formula
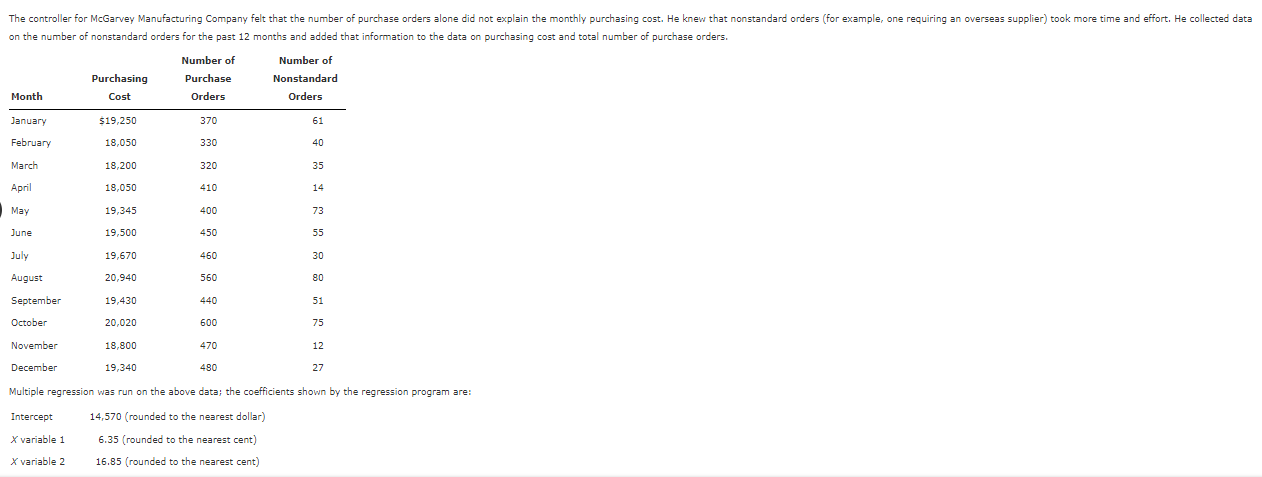
The controller for McGarvey Manufacturing Company felt that the number of purchase orders alone did not explain the monthly purchasing cost. He knew that nonstandard orders for example, one requiring an overseas supplier took more time and effort. He collected data on the number of nonstandard orders for the past months and added that information to the data on purchasing cost and total number of purchase orders.
Month Purchasing Cost Number of Purchase Orders Number of Nonstandard Orders
January $
February
March
April
May
June
July
August
September
October
November
December
Multiple regression was run on the above data; the coefficients shown by the regression program are:
Intercept rounded to the nearest dollar
X variable rounded to the nearest cent
X variable rounded to the nearest cent
Required:
Construct the cost formula for the purchasing activity showing the fixed cost and the variable rate.
$fill in the blank
$fill in the blank
times Purchase orders$fill in the blank
times Nonstandard orders
If McGarvey Manufacturing Company estimates that next month will have total purchase orders and nonstandard orders, what is the total estimated purchasing cost for that month? Round your answer to the nearest dollar.
$fill in the blank
What if McGarvey Manufacturing wants to estimate purchasing cost for the coming year and expects purchase orders and nonstandard orders?
What will estimated total purchasing cost beRound your answer to the nearest dollar.
$fill in the blank
What is the total fixed purchasing cost?
$fill in the blank
Why doesn't it equal the fixed cost calculated in Requirement above?on the number of nonstandard orders for the past months and added that information to the data on purchasing cost and total number of purchase orders.
tableMonthtablePurchasingCosttableNumber ofPurchaseOrderstableNumber ofNonstandardOrdersJanuary$FebruaryMarchAprilMayJuneJulyAugustSeptemberOctoberNovemberDecember
Multiple regression was run on the above data; the coefficients shown by the regression program are:
Intercept rounded to the nearest dollar
variable rounded to the nearest cent
variable rounded to the nearest cent
Step by Step Solution
There are 3 Steps involved in it
1 Expert Approved Answer
Step: 1 Unlock

Question Has Been Solved by an Expert!
Get step-by-step solutions from verified subject matter experts
Step: 2 Unlock
Step: 3 Unlock