

Question: Using Numpy, Matplotlib and SkLearn tools introduced in the video lectures to: 1. Generate 500 random X values from 3 to 3. 2. Generate 500
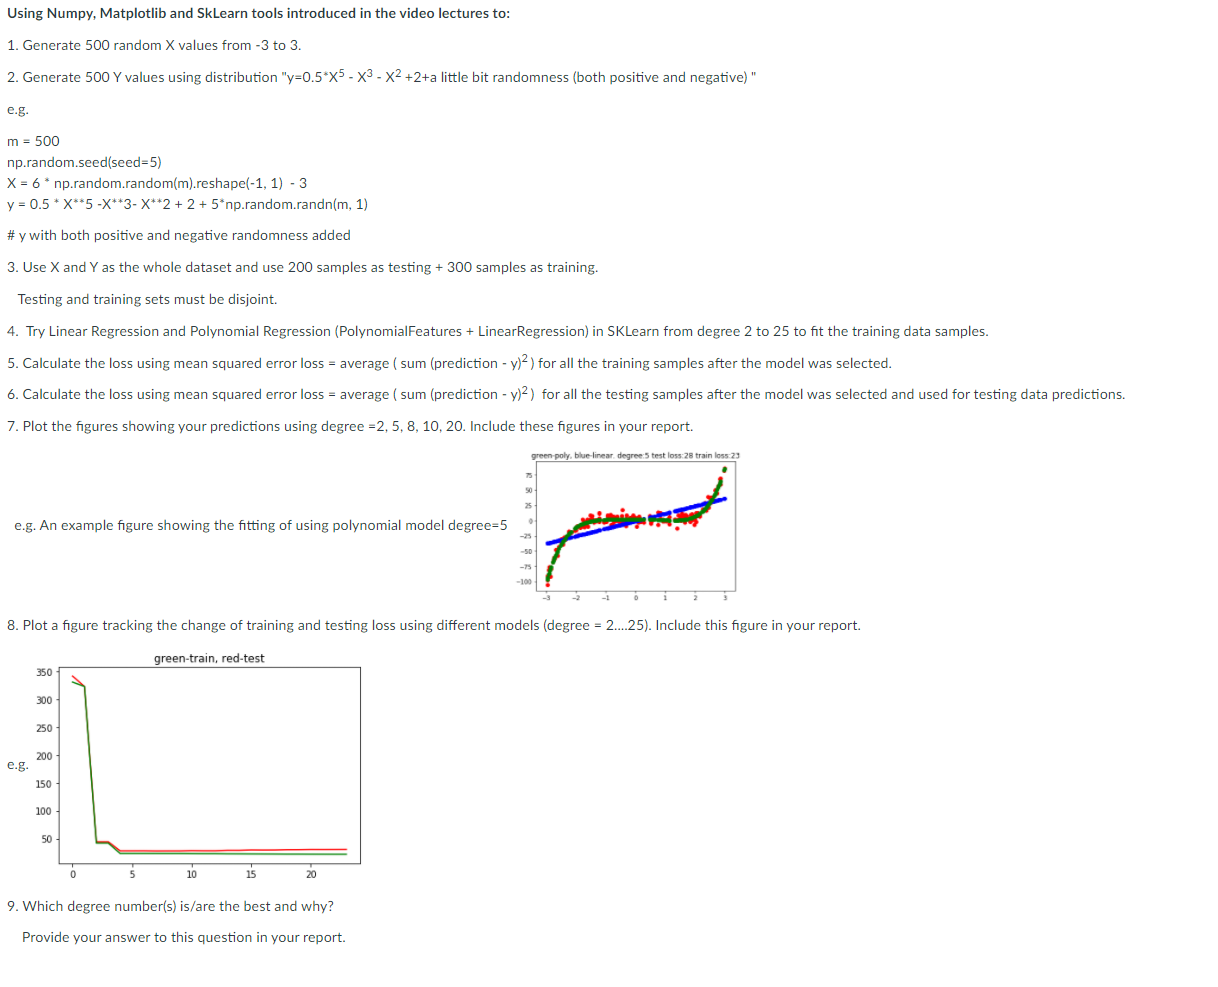
Using Numpy, Matplotlib and SkLearn tools introduced in the video lectures to: 1. Generate 500 random X values from 3 to 3. 2. Generate 500 Y values using distribution "y=0.5*X5- X3-X2 +2+a little bit randomness (both positive and negative)" e.g. m = 500 np.random.seed(seed=5) X = 6* np.random.random(m).reshape(-1, 1) - 3 y = 0.5 * X**5-X**3- X**2 + 2 + 5*np.random.randn(m, 1) #y with both positive and negative randomness added 3. Use X and Y as the whole dataset and use 200 samples as testing + 300 samples as training. Testing and training sets must be disjoint. 4. Try Linear Regression and Polynomial Regression (PolynomialFeatures + LinearRegression) in SKLearn from degree 2 to 25 to fit the training data samples. 5. Calculate the loss using mean squared error loss = average (sum (prediction - y)2) for all the training samples after the model was selected. 6. Calculate the loss using mean squared error loss = average (sum (prediction - y)2) for all the testing samples after the model was selected and used for testing data predictions. 7. Plot the figures showing your predictions using degree -2,5, 8, 10, 20. Include these figures in your report. green poly, blue linear degree:5 test loss: 28 train loss:23 25 e.g. An example figure showing the fitting of using polynomial model degree=5 8. Plot a figure tracking the change of training and testing loss using different models (degree = 2...25). Include this figure in your report. green-train, red-test 350 300 250 200 e.g. 150 100 50 0 5 10 15 20 9. Which degree number(s) is/are the best and why? Provide your answer to this question in your report
Step by Step Solution
There are 3 Steps involved in it

Get step-by-step solutions from verified subject matter experts