

Question: ** Using OCTAVE** Objectives Create an m-file that generates the code to create a contour plot. hitroduction to plotting and using the contour functions. Learning
** Using OCTAVE**
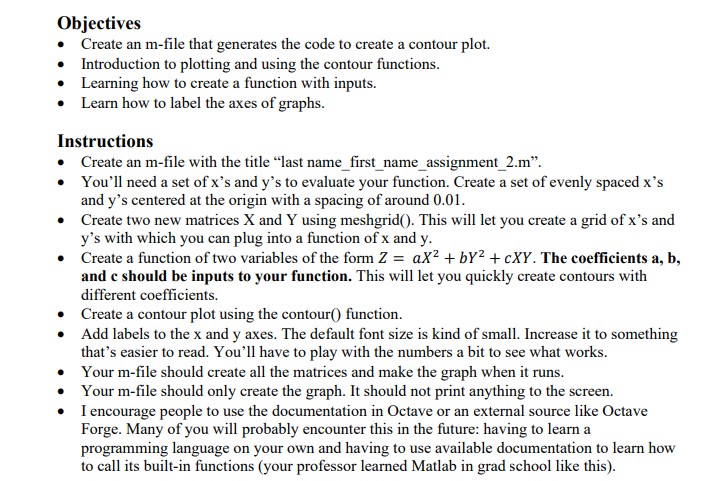
Objectives Create an m-file that generates the code to create a contour plot. hitroduction to plotting and using the contour functions. Learning how to create a function with inputs. Learn how to lahel the axes of graphs. Instructions Create an m-file with the title \"last narne_first_name_assignment_2.m\". You'll need a set of 31's and y's to evaluate your function. Create a set of evenly spaced it's and y's centered at the origin with a spacing of around 0.0 l. Create mo new matrices X and Y using meshgrid. This will let you create a grid of it's and y's with which you can plug into a function of x and y. Create a firnction of two variables of the form Z = 1.th + bl'z + cJt'l'. The coefcients a, b, and e should he inputs to your function. This will let you quickly create contours with different coefficients. Create a contour plot using the contour function. Add labels to the it and y axes. The default font size is kind of small. Increase it to something that's easier to read. You'll have to play with the numbers a bit to see what works. Your m-file should create all the man-lea and make the graph when it runs. Your m-file should only create the graph. It should not print anything to the screen. I encourage people to use the documentation in Dctaye or an external source like Dctaye Forge. Many of you will probably encounter this in the future: having to leam a programming language on your own and having to use available documentation to learn how to call its built-in functions {your professor learned Matlab in grad school like this}
Step by Step Solution
There are 3 Steps involved in it

Get step-by-step solutions from verified subject matter experts