

Question: Using output from Activity 4: Network Analysis and the additional information provided in the table below , we would like you to create a project
Using output from Activity 4: Network Analysis and the additional information provided in the table below, we would like you to create a project schedule Gantt chart and associated resource profile.
Output From Activity 4: Network Analysis: 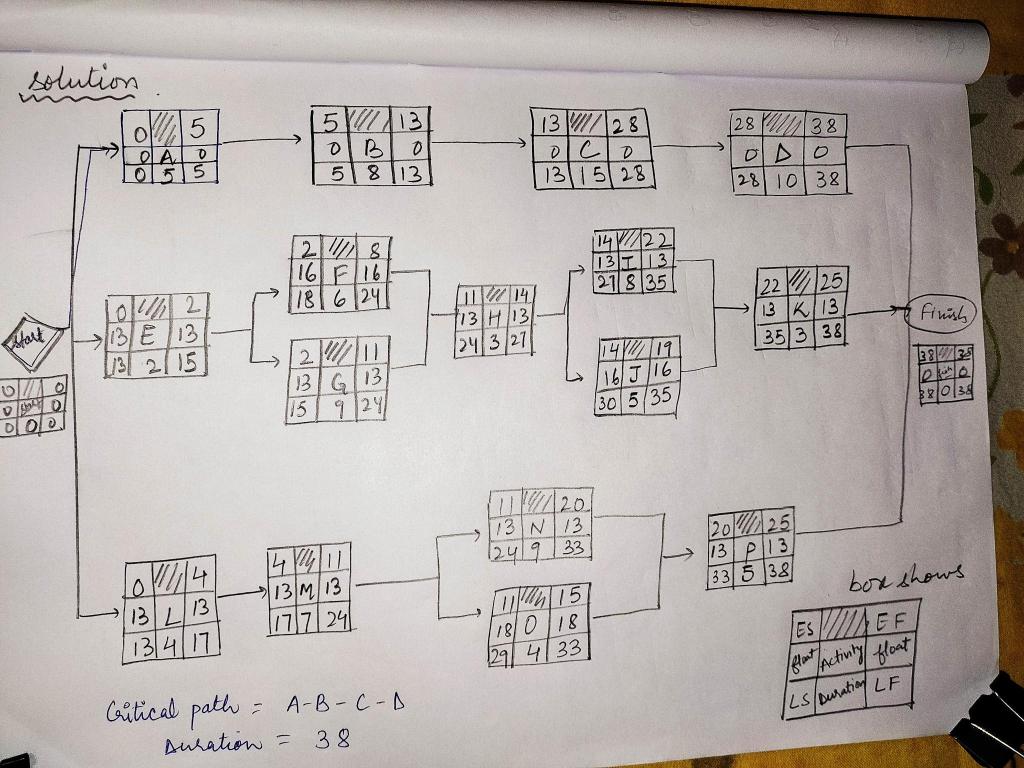
Additional Data:
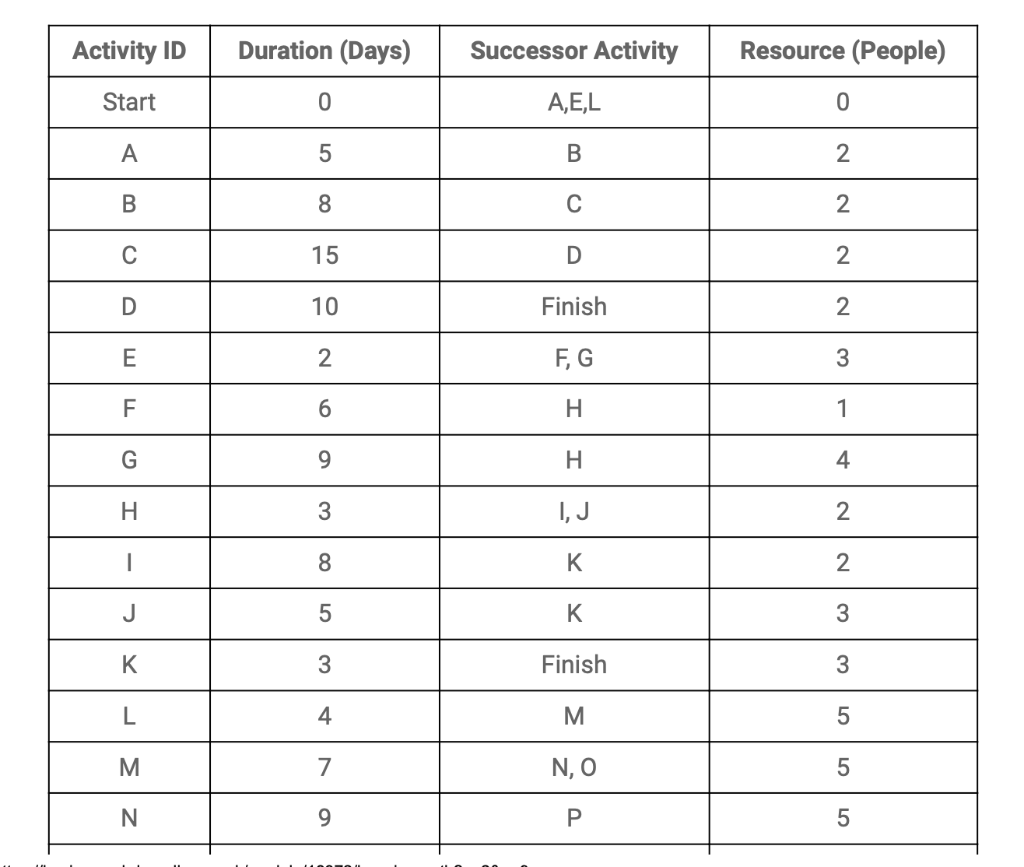
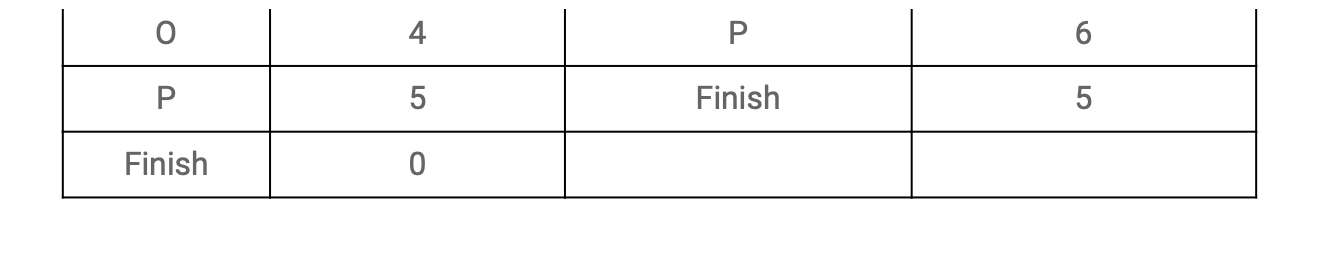
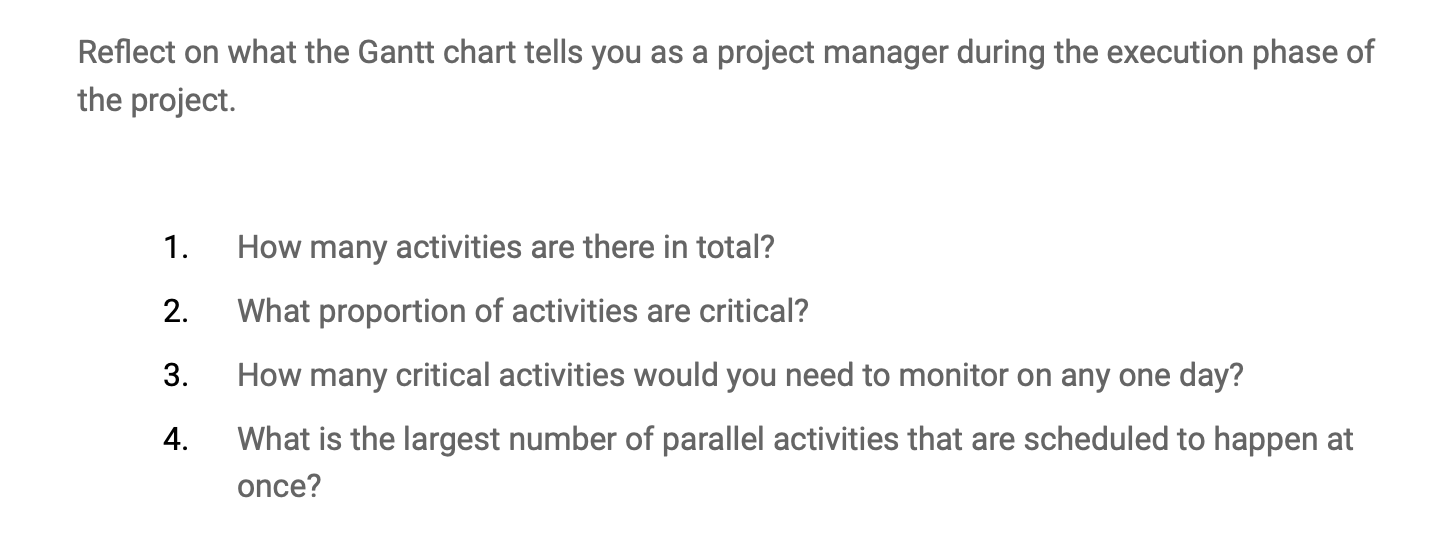
solution. 0/10 DO 000 0 5 0 O A. 1055 04/2 13 E 13 1/3 2/15 1/14 13L13 134 17 5/11/13 B 0 5 8 13 21/8 16 F 16 18 6 24 2/4// ||1 13/G 13 924 15 141/4/11 13 M 13 17 24 Critical path = A-B-C-D Duration = 38 > 11/ 14 13H13 13/28 olclo 1315 28 11////20 13 N 13 124 933 11/15 180 18 29 433 122 137 13 278 35 14//// 19 16/J/16 30 5/35 (2838 O 28 10 38 2225 13 K 13 35 3 38 20%25 13 P13 33 5 38 /float ESEF "/Activity float / Finish 384 235 220/38 box shows. LS/Duration LF Activity ID Start A B C D E F G H I J K L M N Duration (Days) 0 5 8 15 10 2 6 9 3 8 5 3 4 7 9 Successor Activity A,E,L B C D Finish F, G H H I, J K K Finish M N, O P Resource (People) 0 2 2 2 2 3 1 4 2 2 3 3 01 5 5 5 O P Finish 4 LO 5 O P Finish 6 5 Reflect on what the Gantt chart tells you as a project manager during the execution phase of the project. 1. 2. 3. 4. How many activities are there in total? What proportion of activities are critical? How many critical activities would you need to monitor on any one day? What is the largest number of parallel activities that are scheduled to happen at once
Step by Step Solution
There are 3 Steps involved in it
1 Expert Approved Answer
Step: 1 Unlock

Question Has Been Solved by an Expert!
Get step-by-step solutions from verified subject matter experts
Step: 2 Unlock
Step: 3 Unlock