

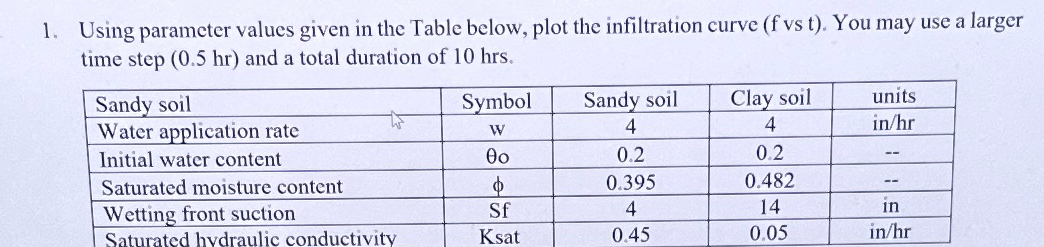
Question: Using parameter values given in the Table below, plot the infiltration curve ( f vs t ) . You may use a larger time step
Using parameter values given in the Table below, plot the infiltration curve vs You may use a larger time step and a total duration of
tableSandy soil,Symbol,Sandy soil,Clay soil,unitsWater application rate,w
Step by Step Solution
There are 3 Steps involved in it
1 Expert Approved Answer
Step: 1 Unlock

Question Has Been Solved by an Expert!
Get step-by-step solutions from verified subject matter experts
Step: 2 Unlock
Step: 3 Unlock