

Question: Please help with this assignment. You need to use MATLAB (preferably a latest version). Please complete part 1 to 4 please and use the following
Please help with this assignment. You need to use MATLAB (preferably a latest version). Please complete part 1 to 4 please and use the following functions from above. You can also use the "figure" function. Thanks in advance.
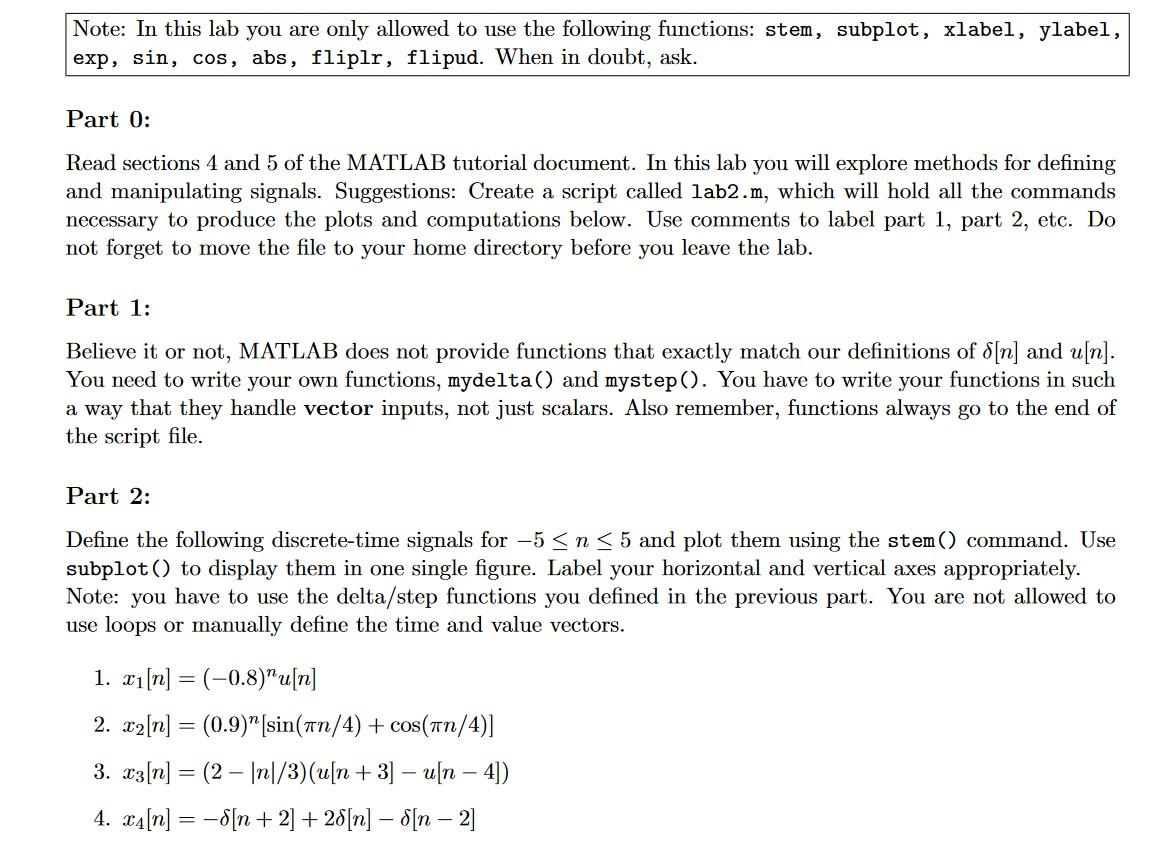
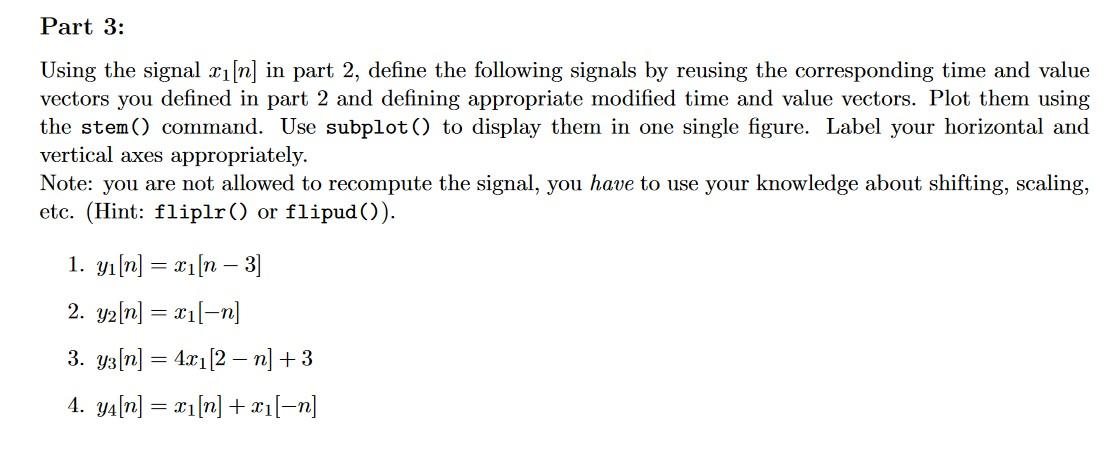
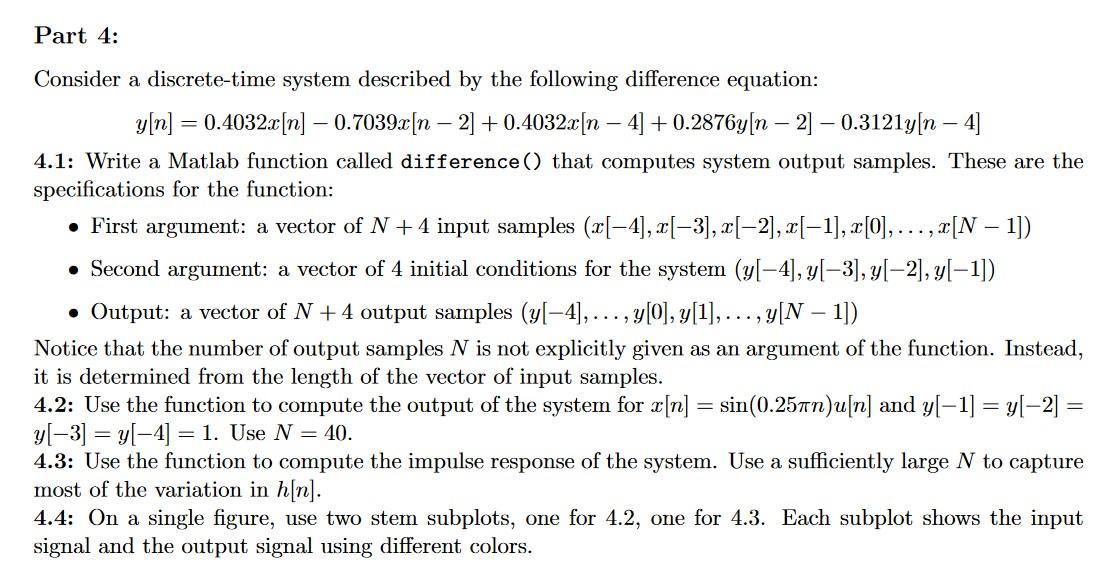
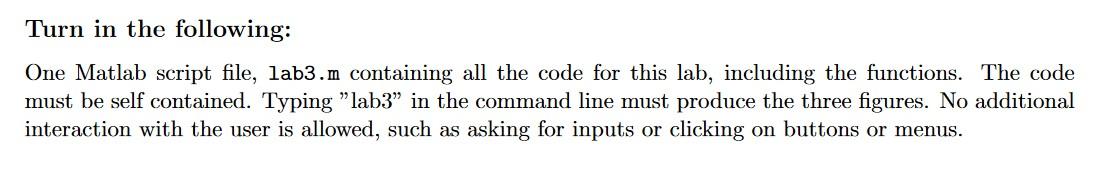
Note: In this lab you are only allowed to use the following functions: stem, subplot, xlabel, ylabel, exp, sin, cos, abs, fliplr, flipud. When in doubt, ask. Part 0: Read sections 4 and 5 of the MATLAB tutorial document. In this lab you will explore methods for defining and manipulating signals. Suggestions: Create a script called 1ab2m, which will hold all the commands necessary to produce the plots and computations below. Use comments to label part 1, part 2, etc. Do not forget to move the file to your home directory before you leave the lab. Part 1: Believe it or not, MATLAB does not provide functions that exactly match our definitions of [n] and u[n]. You need to write your own functions, mydelta() and mystep(). You have to write your functions in such a way that they handle vector inputs, not just scalars. Also remember, functions always go to the end of the script file. Part 2: Define the following discrete-time signals for 5n5 and plot them using the stem() command. Use subplot() to display them in one single figure. Label your horizontal and vertical axes appropriately. Note: you have to use the delta/step functions you defined in the previous part. You are not allowed to use loops or manually define the time and value vectors. 1. x1[n]=(0.8)nu[n] 2. x2[n]=(0.9)n[sin(n/4)+cos(n/4)] 3. x3[n]=(2n/3)(u[n+3]u[n4]) 4. x4[n]=[n+2]+2[n][n2] Using the signal x1[n] in part 2 , define the following signals by reusing the corresponding time and value vectors you defined in part 2 and defining appropriate modified time and value vectors. Plot them using the stem() command. Use subplot() to display them in one single figure. Label your horizontal and vertical axes appropriately. Note: you are not allowed to recompute the signal, you have to use your knowledge about shifting, scaling, etc. (Hint: fliplr() or flipud()). 1. y1[n]=x1[n3] 2. y2[n]=x1[n] 3. y3[n]=4x1[2n]+3 4. y4[n]=x1[n]+x1[n] Consider a discrete-time system described by the following difference equation: y[n]=0.4032x[n]0.7039x[n2]+0.4032x[n4]+0.2876y[n2]0.3121y[n4] 4.1: Write a Matlab function called difference() that computes system output samples. These are the specifications for the function: - First argument: a vector of N+4 input samples (x[4],x[3],x[2],x[1],x[0],,x[N1]) - Second argument: a vector of 4 initial conditions for the system (y[4],y[3],y[2],y[1]) - Output: a vector of N+4 output samples (y[4],,y[0],y[1],,y[N1]) Notice that the number of output samples N is not explicitly given as an argument of the function. Instead, it is determined from the length of the vector of input samples. 4.2: Use the function to compute the output of the system for x[n]=sin(0.25n)u[n] and y[1]=y[2]= y[3]=y[4]=1. Use N=40. 4.3: Use the function to compute the impulse response of the system. Use a sufficiently large N to capture most of the variation in h[n]. 4.4: On a single figure, use two stem subplots, one for 4.2, one for 4.3. Each subplot shows the input signal and the output signal using different colors. Turn in the following: One Matlab script file, lab3.m containing all the code for this lab, including the functions. The code must be self contained. Typing "lab3" in the command line must produce the three figures. No additional interaction with the user is allowed, such as asking for inputs or clicking on buttons or menus. - General requirements: - Execution errors will not be corrected by the grader. Results beyond the place where the errors occurs will be ignored. - Code that uses functions not on the allowed list will be ignored. - (30\%) Parts 1 and 2: - Functions defined and handle vector inputs, not just scalars. - Four stem plots on a single figure. - Horizontal and vertical axes labeled appropriately. - The signals are defined using the delta/step functions, not manually or using loops. - (30\%) Part 3: - Four stem plots on a single figure. - Horizontal and vertical axes labeled appropriately. - The code reuses time and value vectors defined in part 2, does not recompute them. - (40\%) Part 4: - Function difference () implemented and fits the description. - A single figure with two subplots, one subplot for 4.2, one for 4.3. - Each subplot shows input signal and output signal using different colors. - Horizontal and vertical axes labeled appropriately
Step by Step Solution
There are 3 Steps involved in it

Get step-by-step solutions from verified subject matter experts