

Question: Using PivotTables, compute the mean and standard deviation for each metric by year in the Excel file Freshman College Data. Are any differences apparent from
- Using PivotTables, compute the mean and standard deviation for each metric by year in the Excel file Freshman College Data. Are any differences apparent from year to year
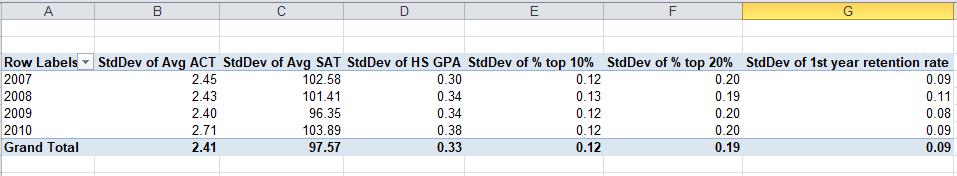
A B E F Row Labels StdDev of Avg ACT StdDev of Avg SAT StdDev of HS GPA StdDev of % top 10% StdDev of % top 20% StdDev of 1st year retention rate 2007 2008 2.45 102.58 0.30 0.12 0.20 2.43 101.41 0.34 0.13 0.19 2009 2.40 96.35 0.34 0.12 0.20 2010 2.71 103.89 0.38 0.12 0.20 Grand Total 2.41 97.57 0.33 0.12 0.19 0.09 0.11 0.08 0.09 0.09
Step by Step Solution
There are 3 Steps involved in it
1 Expert Approved Answer
Step: 1 Unlock

Question Has Been Solved by an Expert!
Get step-by-step solutions from verified subject matter experts
Step: 2 Unlock
Step: 3 Unlock