

Question: Using provided data, provide a report that identifies the energy improvement opportunities. (perform calculations to show the savings) This site only has an electricity supply
Using provided data, provide a report that identifies the energy improvement opportunities. (perform calculations to show the savings)
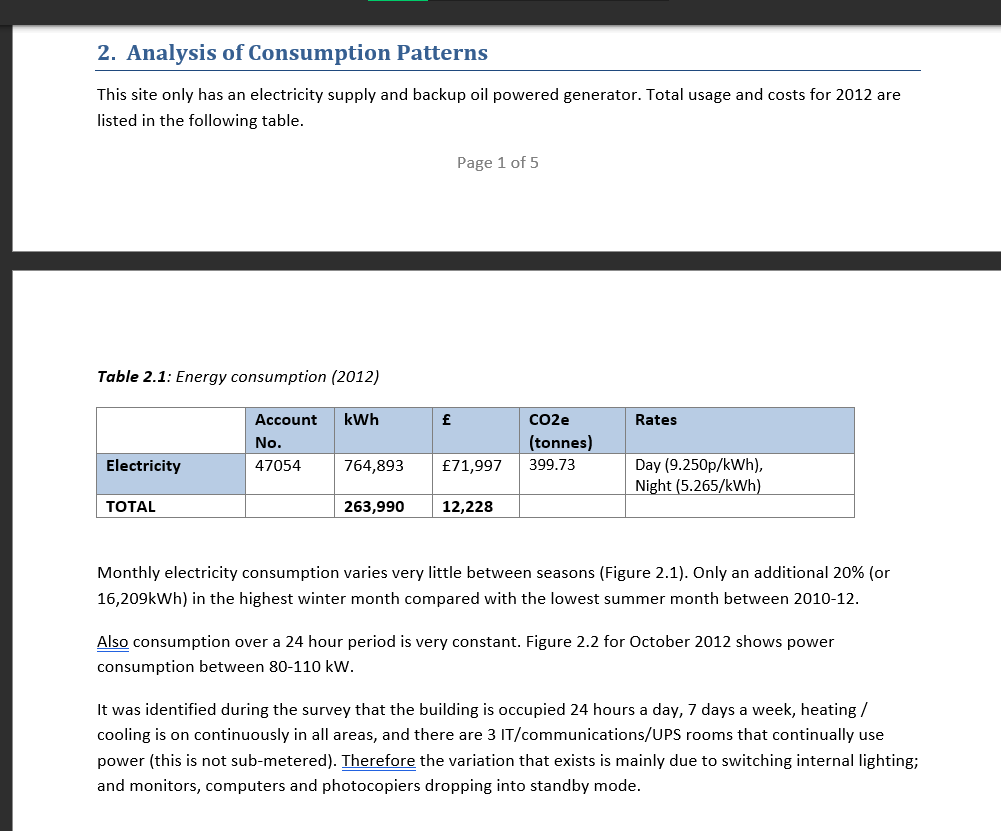
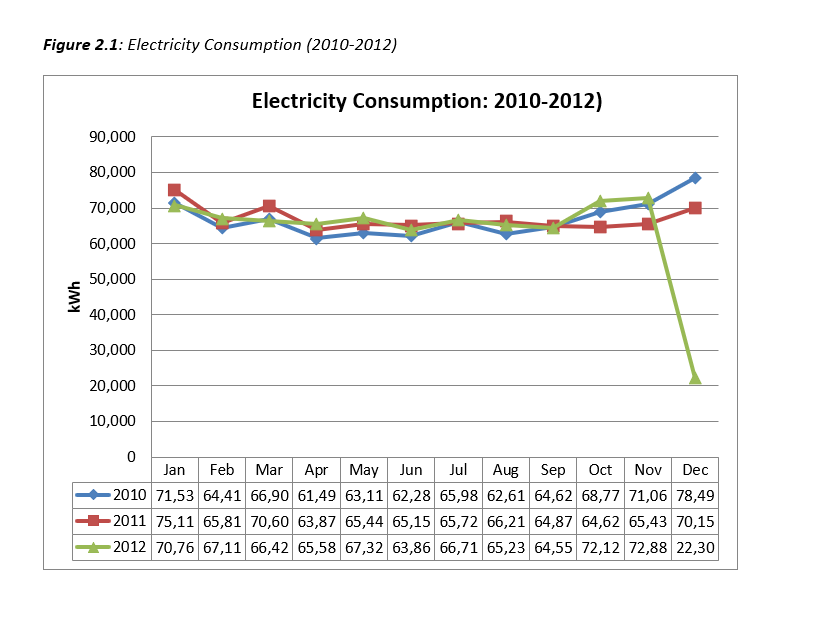
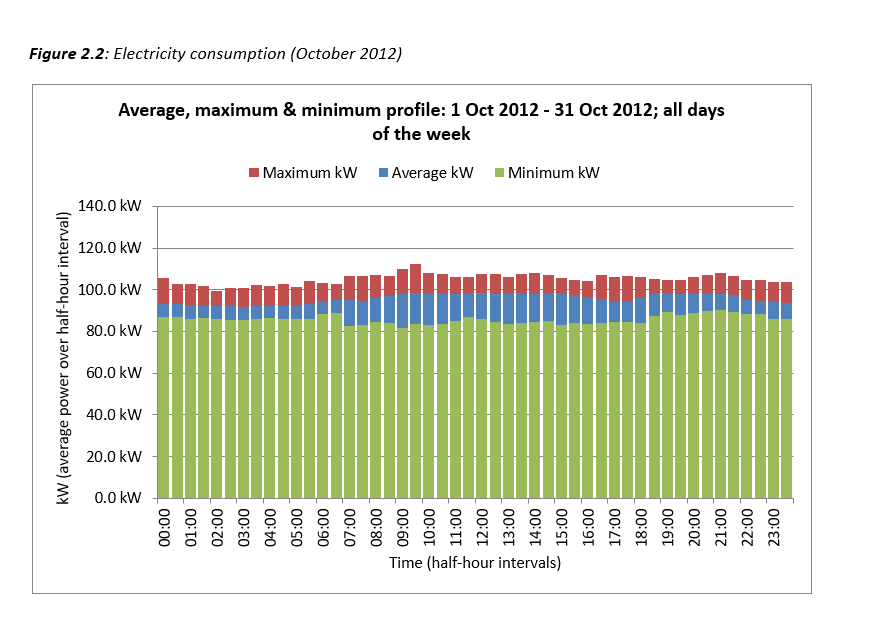
This site only has an electricity supply and backup oil powered generator. Total usage and costs for 2012 are listed in the following table. Page 1 of 5 Table 2.1: Energy consumption (2012) Monthly electricity consumption varies very little between seasons (Figure 2.1). Only an additional 20% (or 16,209kWh ) in the highest winter month compared with the lowest summer month between 201012. Also consumption over a 24 hour period is very constant. Figure 2.2 for October 2012 shows power consumption between 80110kW. It was identified during the survey that the building is occupied 24 hours a day, 7 days a week, heating / power (this is not sub-metered). Therefore the variation that exists is mainly due to switching internal lighting; and monitors, computers and photocopiers dropping into standby mode. Figure 2.1: Electricity Consumption (2010-2012) Figure 2.2: Electricity consumption (October 2012) Average, maximum \& minimum profile: 1 Oct 2012 - 31 Oct 2012; all days of the week This site only has an electricity supply and backup oil powered generator. Total usage and costs for 2012 are listed in the following table. Page 1 of 5 Table 2.1: Energy consumption (2012) Monthly electricity consumption varies very little between seasons (Figure 2.1). Only an additional 20% (or 16,209kWh ) in the highest winter month compared with the lowest summer month between 201012. Also consumption over a 24 hour period is very constant. Figure 2.2 for October 2012 shows power consumption between 80110kW. It was identified during the survey that the building is occupied 24 hours a day, 7 days a week, heating / power (this is not sub-metered). Therefore the variation that exists is mainly due to switching internal lighting; and monitors, computers and photocopiers dropping into standby mode. Figure 2.1: Electricity Consumption (2010-2012) Figure 2.2: Electricity consumption (October 2012) Average, maximum \& minimum profile: 1 Oct 2012 - 31 Oct 2012; all days of the week
Step by Step Solution
There are 3 Steps involved in it

Get step-by-step solutions from verified subject matter experts