

Question: USING PYTHON 1)Download the heart.csv dataset from the Blackboard and use read_csv( ) to read it. 2. Creat a new column named 'age_cat ' in
USING PYTHON
1)Download the heart.csv dataset from the Blackboard and use read_csv( ) to read it.
2. Creat a new column named 'age_cat' in the DataFrame to present individuals' age with 4 categories. Here is the list of categories: 25-40 ; 40-55; 55-70; 70+
3. Creat a pie chart to show the percentage of individuals in each age category. Use the Explode feature of pie chart in matplotlib to separate the age category of 40- 55.
4. Creat a histogram with with 20 bins and white edgecolor to visualize the distribution of "chol" feature. Then use the annotation function to point to the bin with the highest value.
Sorry, I couldn't attach the excel file or put the link to download the file too, could you please use the data in the pic below to solve the questions.
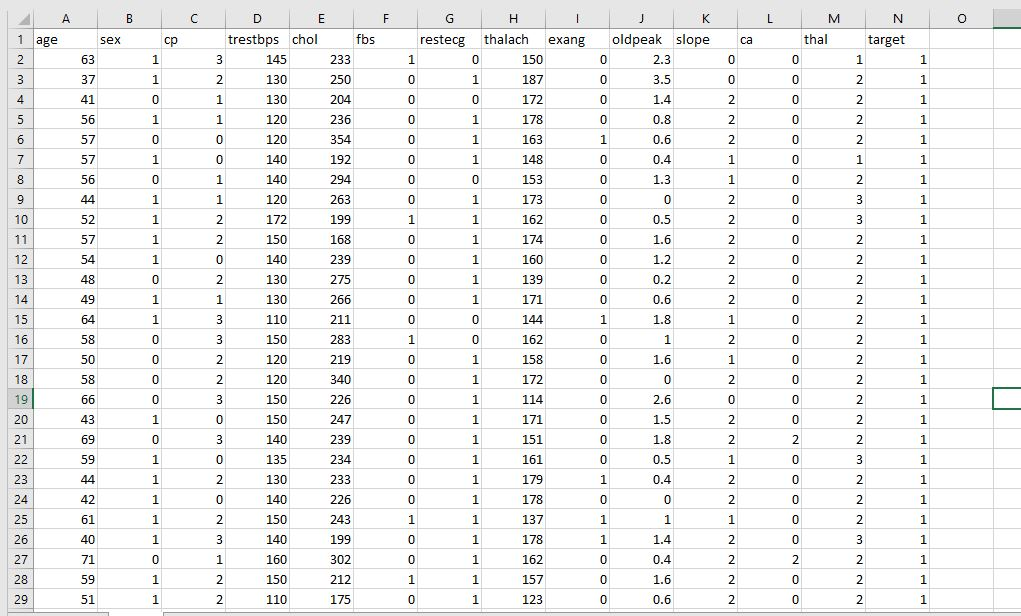
1222212332222222222232223222 0000000000000000000200000200 0022211222222121202212212222 3548643056226816065854014466 2310001 011001-21100 1010 0000100000000100000001011000 3324 6 4111 878 1000000010000010000000010010 6139 679 363 2112222 2 2 2 331 0 p111 1e 3211001122021332230302023122 2 5 1 1 2 5 123456789 012345678901 4 8 1222212332222222222232223222 0000000000000000000200000200 0022211222222121202212212222 3548643056226816065854014466 2310001 011001-21100 1010 0000100000000100000001011000 3324 6 4111 878 1000000010000010000000010010 6139 679 363 2112222 2 2 2 331 0 p111 1e 3211001122021332230302023122 2 5 1 1 2 5 123456789 012345678901 4 8
Step by Step Solution
There are 3 Steps involved in it

Get step-by-step solutions from verified subject matter experts