

Question: Using python, I need help with reading a list (.txt) and finding the average, standard deviation, and frequencies of the grades. Any help would be
Using python, I need help with reading a list (.txt) and finding the average, standard deviation, and frequencies of the grades.
Any help would be much appreciated!!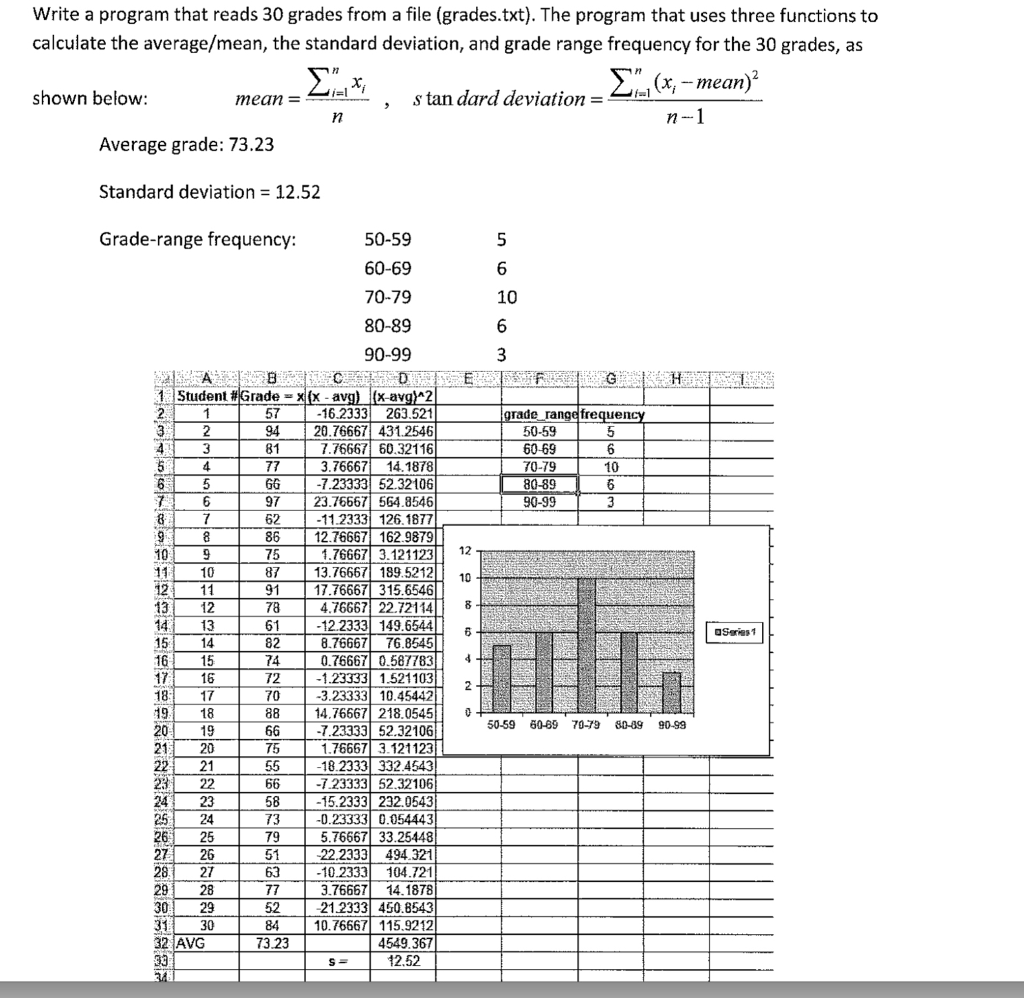
Write a program that reads 30 grades from a file (grades.txt). The program that uses three functions to calculate the average/mean, the standard deviation, and grade range frequency for the 30 grades, as 9 5 (x,-mean) shown below mean s tan dard deviation Average grade: 73.23 Standard deviation = 12.52 Grade-range frequency: 90-99 | | Student #Grade- d(x-avg) |(X-avg)^2 16.2333263.521 94 20.76667 4312546 7.76667 60.32116 3.7666714.1878 7.2333352.32106 97 23.76667 564.8546 11.2333 126.1877 86 12 76667 162 9879 1.76667 3.12112312 13.76667 189.5212 10 4.76667 227114 8 12.2333 149.6544 6 8.76667 768545 0.76667 0.5877834 1.23333 1.521103 3.23333 10.45442 88 14.76667218.0545 19 | -661.-7.233331 52.32106 1.76667 3.121123 18.2333 332.4543 7.2333352.32106 50-59 60-89 70-79 80-89 90-99 15.2333 232.0543 -0.23333 0.054443 5.76667 3325448 22.2333494.321 10.2333104.721 3.76667 14.1878 21.2333 450.8543 10.76667 115.9212 4549.367 73 5
Step by Step Solution
There are 3 Steps involved in it

Get step-by-step solutions from verified subject matter experts