

Question: Using Python (Jupyter notebook) , create a function that calculates the empirical cumulative data function of an array. Use the function to calculate the ECDFs
Using Python (Jupyter notebook), create a function that calculates the empirical cumulative data function of an array. Use the function to calculate the ECDFs of the three species of Iris (you will need the three following datasets: setosa_sepal_length.csv, versicolor_sepal_length.csv, and virginica_sepal_length.csv). Plot the ECDFs on a single axis.
can someone help me with this? the plot i got wasn't even an ECDF, they were just random dots on a graph. (the picture below is how each data set looks like, you can make a similar data set that looks like it) thank you so much! will upvote
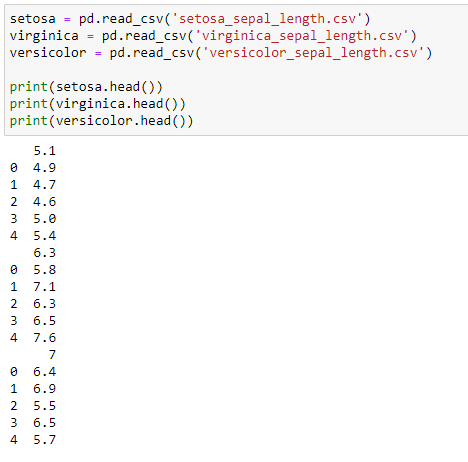
setosa = pd.read_csv('setosa_sepal_length.csv') virginica = pd.read_csv('virginica_sepal_length.csv') versicolor = pd.read_csv('versicolor_sepal_length.csv') print(setosa.head() print(virginica.head() print(versicolor.head() 5.1 0 4.9 1 4.7 2 4.6 3 5.0 4 5.4 6.3 0 5.8 1 7.1 2 6.3 3 6.5 4 7.6 7 0 6.4 1 6.9 2 5.5 3 6.5 4 5.7
Step by Step Solution
There are 3 Steps involved in it

Get step-by-step solutions from verified subject matter experts