

Question: using Python to figure out it, show the code and plots. Thank you so much! Plot the first year of the data for the United

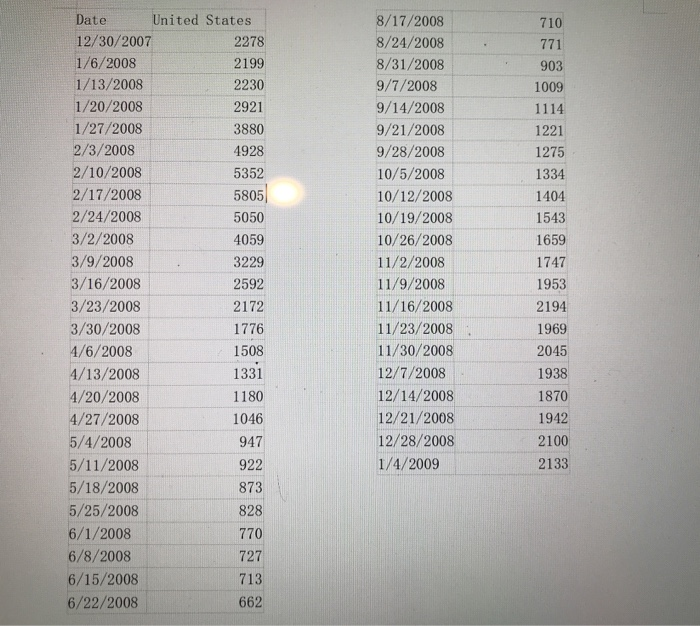

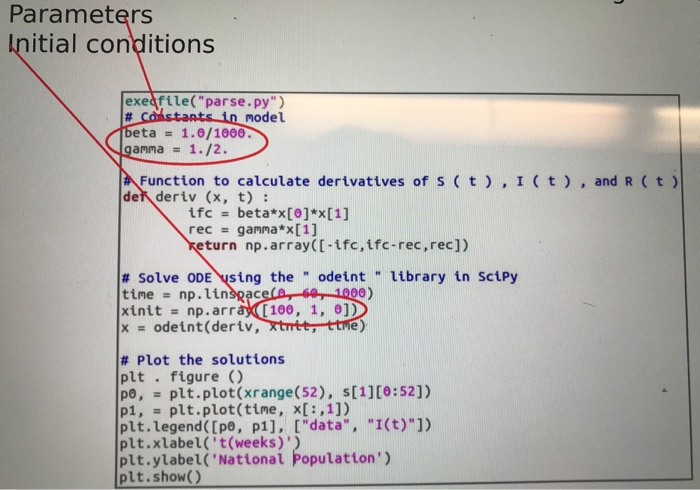
Plot the first year of the data for the United States. Try to find parameters of the SIR model such that the model fits the data well. Play around with it until you find something that works. Are the parameters reasonable given what you know about the flu? 710 771 903 1009 1114 1221 1275 8/17/2008 8/24/2008 8/31/2008 9/7/2008 9/14/2008 9/21/2008 9/28/2008 10/5/2008 10/12/2008 10/19/2008 10/26/2008 11/2/2008 11/9/2008 11/16/2008 11/23/2008 11/30/2008 12/7/2008 12/14/2008 12/21/2008 12/28/2008 1/4/2009 1334 1404 1543 1659 Date United States 12/30/2007 2278 1/6/2008 2199 1/13/2008 2230 1/20/2008 2921 1/27/2008 3880 2/3/2008 4928 2/10/2008 5352 2/17/2008 5805 2/24/2008 5050 3/2/2008 4059 3/9/2008 3229 3/16/2008 2592 3/23/2008 2172 3/30/2008 1776 4/6/2008 1508 4/13/2008 1331 4/20/2008 1180 4/27/2008 1046 5/4/2008 947 5/11/2008 922 5/18/2008 873 5/25/2008 828 6/1/2008 770 6/8/2008 727 6/15/2008 713 6/22/2008 662 1747 1953 2194 1969 2045 1938 1870 1942 2100 2133 Finding a good fit is hard. Focus on trying to fit a few aspects of the graph: a) The maximum number of infected people. This happens when di/dt = 0 or S =Y/B. b) The timescale for getting to this maximum. c) The timescale for recovery. Parameters Initial conditions exedfile("parse.py") # Constants in model beta = 1.0/1000. gamma = 1./2. Function to calculate derivatives of s (t),I(t), and R ( t) del deriv (x, t) : ifc = beta*x[0]*x[1] rec = gamma*x[1] Keturn np.array([-tfc, tfc-rec, rec]) # Solve ODE using the " odeint " library in Scipy time = np.linspace(e, 50, 1000) xinit = np.array(100, 1, 0]) X = odeint(deriv, xtutt, ttme) # Plot the solutions plt . figure () po, - plt.plot(xrange(52), [1][0:52]) pi, - plt.plot(tine, x[:,1]) plt.legend([po, p1], ["data", "I(t)"]) plt.xlabel('t(weeks)') plt.ylabel('National population) plt.show() Plot the first year of the data for the United States. Try to find parameters of the SIR model such that the model fits the data well. Play around with it until you find something that works. Are the parameters reasonable given what you know about the flu? 710 771 903 1009 1114 1221 1275 8/17/2008 8/24/2008 8/31/2008 9/7/2008 9/14/2008 9/21/2008 9/28/2008 10/5/2008 10/12/2008 10/19/2008 10/26/2008 11/2/2008 11/9/2008 11/16/2008 11/23/2008 11/30/2008 12/7/2008 12/14/2008 12/21/2008 12/28/2008 1/4/2009 1334 1404 1543 1659 Date United States 12/30/2007 2278 1/6/2008 2199 1/13/2008 2230 1/20/2008 2921 1/27/2008 3880 2/3/2008 4928 2/10/2008 5352 2/17/2008 5805 2/24/2008 5050 3/2/2008 4059 3/9/2008 3229 3/16/2008 2592 3/23/2008 2172 3/30/2008 1776 4/6/2008 1508 4/13/2008 1331 4/20/2008 1180 4/27/2008 1046 5/4/2008 947 5/11/2008 922 5/18/2008 873 5/25/2008 828 6/1/2008 770 6/8/2008 727 6/15/2008 713 6/22/2008 662 1747 1953 2194 1969 2045 1938 1870 1942 2100 2133 Finding a good fit is hard. Focus on trying to fit a few aspects of the graph: a) The maximum number of infected people. This happens when di/dt = 0 or S =Y/B. b) The timescale for getting to this maximum. c) The timescale for recovery. Parameters Initial conditions exedfile("parse.py") # Constants in model beta = 1.0/1000. gamma = 1./2. Function to calculate derivatives of s (t),I(t), and R ( t) del deriv (x, t) : ifc = beta*x[0]*x[1] rec = gamma*x[1] Keturn np.array([-tfc, tfc-rec, rec]) # Solve ODE using the " odeint " library in Scipy time = np.linspace(e, 50, 1000) xinit = np.array(100, 1, 0]) X = odeint(deriv, xtutt, ttme) # Plot the solutions plt . figure () po, - plt.plot(xrange(52), [1][0:52]) pi, - plt.plot(tine, x[:,1]) plt.legend([po, p1], ["data", "I(t)"]) plt.xlabel('t(weeks)') plt.ylabel('National population) plt.show()
Step by Step Solution
There are 3 Steps involved in it

Get step-by-step solutions from verified subject matter experts