

Question: Using Python3, Download the data file which lists the counts-per-second of the Geiger counter here: http:/ordlie.cs.und.edu/cs270/data/datalogging/geiger.csv (the csv file has units of counts-per-second). Calculate the
Using Python3,
Download the data file which lists the counts-per-second of the Geiger counter here: http:/ordlie.cs.und.edu/cs270/data/datalogging/geiger.csv (the csv file has units of counts-per-second). Calculate the counts-per-minute and counts-per-hour rates for these data and plot them on three line graphs with appropriate labels. Here is an example of what the output should look like:
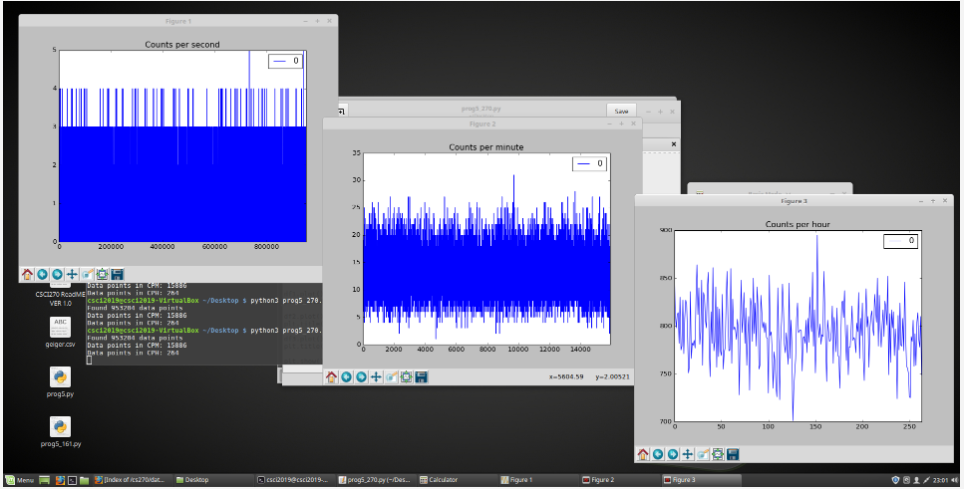
Counts per second Counts per minute Counts per hour 200000 DOO W POLNEM CSO ROSAVE VER 10 csc12819csc12019-VirtualBox -/Desktop $ python3 progs 278 TO FREE gogoro csc1201305012019-VirtualBox -/Desktop $ python progs 270. Data points in CP: 15886 te points in C : 286 0 0 3000 20000 2000 24000 % 2000 2000 00+ OH -5604.59y0021 750 propy 100 5 0 100 150 200 250 prog5_1618 Menu O p index of 270 . Dop 1 c2019 proge 270271-bes. Calculator Figure 1 Figure 2 Figure 3 Counts per second Counts per minute Counts per hour 200000 DOO W POLNEM CSO ROSAVE VER 10 csc12819csc12019-VirtualBox -/Desktop $ python3 progs 278 TO FREE gogoro csc1201305012019-VirtualBox -/Desktop $ python progs 270. Data points in CP: 15886 te points in C : 286 0 0 3000 20000 2000 24000 % 2000 2000 00+ OH -5604.59y0021 750 propy 100 5 0 100 150 200 250 prog5_1618 Menu O p index of 270 . Dop 1 c2019 proge 270271-bes. Calculator Figure 1 Figure 2 Figure 3
Step by Step Solution
There are 3 Steps involved in it

Get step-by-step solutions from verified subject matter experts