

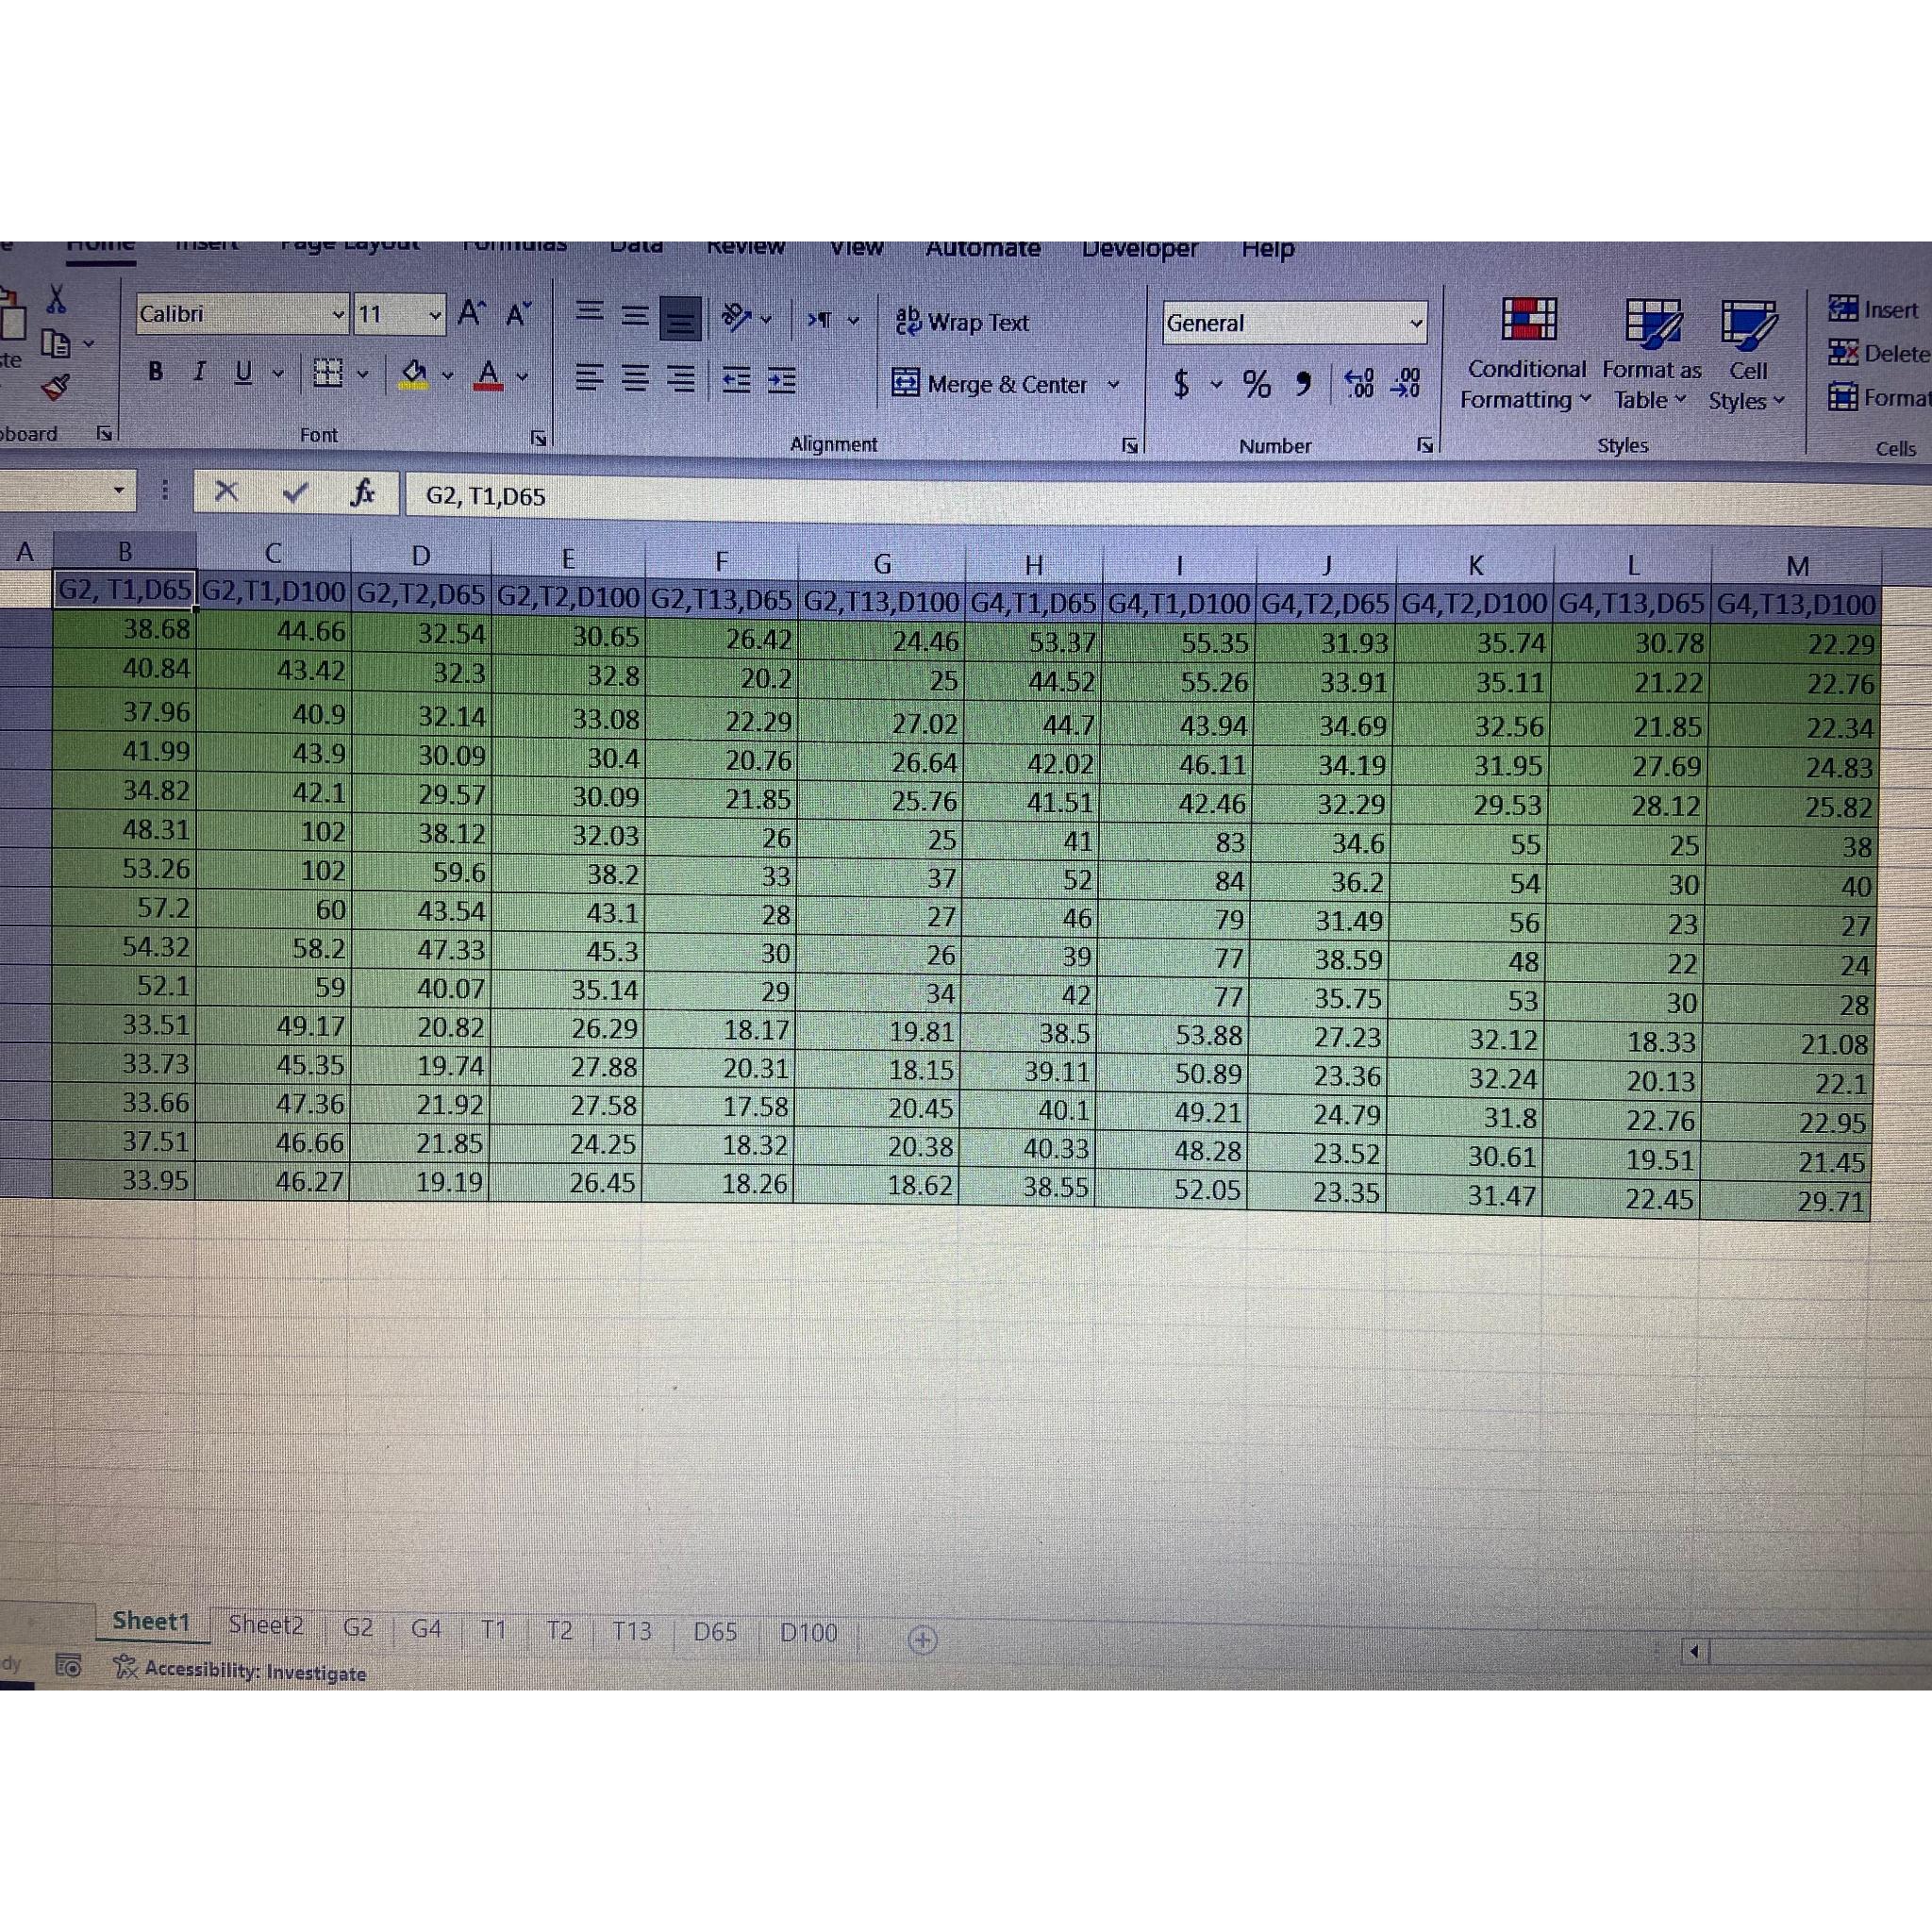
Question: Using PythonCreate a code that calculates descriptive statistics and draws a histogram, boxplot, and bar chart for each of the cases in the column headers.So
Using PythonCreate a code that calculates descriptive statistics and draws a histogram, boxplot, and bar chart for each of the cases in the column headers.So for example, it collects all the data under any column in its G head and creates for it what it requested previouslyThe cases I want areG G D D T T T
Step by Step Solution
There are 3 Steps involved in it
1 Expert Approved Answer
Step: 1 Unlock

Question Has Been Solved by an Expert!
Get step-by-step solutions from verified subject matter experts
Step: 2 Unlock
Step: 3 Unlock