

Question: Using R language for Statistics Lab 4: Confounding and Sampling 1. Consider the state.x77 pre-loaded R dataset that presents some statistics about the fifty states,
Using R language for Statistics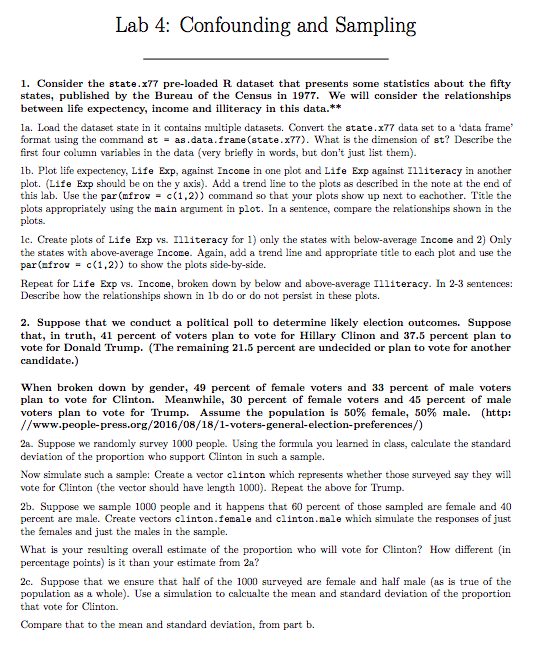
Lab 4: Confounding and Sampling 1. Consider the state.x77 pre-loaded R dataset that presents some statistics about the fifty states, published by the Bureau of the Census in 1977. We will consider the relationships between life expectency, income and illiteracy in this data.** la. Load the dataset state in it contains multiple datasets. Convert the state.x77 data set to a data frame format using the command st-as.data.frame (state.x77). What is the dimension of st? Describe the first four column variables in the data (very briefly in words, but don't just list th lb. Plot life expectency, Life Exp, against Income in one plot and Life Exp against Illiteracy in another plot. (Life Exp should be on the y axis). Add a trend line to the plots as described in the note at the end of this lab. Use the par (mfrow = c (1,2)) command so that your plots show up next to eachother. Title the plots appropriately using the main argument in plot. In a sentence, compare the relationships shown in the plots. le. Create plots of Life Exp vs. Illiteracy for 1) only the states with below-average Income and 2) Only the states with above-average Income. Again, add a trend line and appropriate title to each plot and use the par(nfrou1)) to show the plots side-by-side. Repeat for Life Exp vs. Income, broken down by below and above-average Illiteracy. In 2-3 sentences: Describe how the relationships shown in lb do or do not persist in these plots. 2. Suppose that we conduct a political poll to determine likely election outcomes. Suppose that, in truth, 41 percent of voters plan to vote for Hillary Clinon and 37.5 percent plan to vote for Donald Trump. (The remaining 21.5 percent are undecided or plan to vote for another When broken down by gender, 49 percent of female voters and 33 percent of male voters plan to vote for Clinton. Meanwhile, 30 percent of female voters and 45 percent of male voters plan to vote for Trump. Assume the population is 50% female, 50% male. (http: //www.people-press.org/2016/08/18/1-voters-general-election-preferences/) 2a. Suppose we randomly survey 1000 people. Using the formula you learned in class, calculate the standard deviation of the proportion who support Clinton in such a sample. Now simulate such a sample: Create a vector clinton which represents whether those surveyed say they will vote for Clinton (the vector should have length 1000). Repeat the above for Trump. 2b. Suppose we sample 1000 people and it happens that 60 percent of those sampled are female and 40 peroent are male. Create vectors clinton.female and clinton.nale which simulate the responses of just the females and just the males in the sample. What is your resulting overall estimate of the proportion who will vote for Clinton? How different in percentage points) is it than your estimate from 2a? 2c. Suppose that we ensure that half of the 1000 surveyed are female and half male (as is true of the population as a whole). Use a simulation to calcualte the mean and standard deviation of the proportion that vote for Clinton Compare that to the mean and standard deviation, from part b Lab 4: Confounding and Sampling 1. Consider the state.x77 pre-loaded R dataset that presents some statistics about the fifty states, published by the Bureau of the Census in 1977. We will consider the relationships between life expectency, income and illiteracy in this data.** la. Load the dataset state in it contains multiple datasets. Convert the state.x77 data set to a data frame format using the command st-as.data.frame (state.x77). What is the dimension of st? Describe the first four column variables in the data (very briefly in words, but don't just list th lb. Plot life expectency, Life Exp, against Income in one plot and Life Exp against Illiteracy in another plot. (Life Exp should be on the y axis). Add a trend line to the plots as described in the note at the end of this lab. Use the par (mfrow = c (1,2)) command so that your plots show up next to eachother. Title the plots appropriately using the main argument in plot. In a sentence, compare the relationships shown in the plots. le. Create plots of Life Exp vs. Illiteracy for 1) only the states with below-average Income and 2) Only the states with above-average Income. Again, add a trend line and appropriate title to each plot and use the par(nfrou1)) to show the plots side-by-side. Repeat for Life Exp vs. Income, broken down by below and above-average Illiteracy. In 2-3 sentences: Describe how the relationships shown in lb do or do not persist in these plots. 2. Suppose that we conduct a political poll to determine likely election outcomes. Suppose that, in truth, 41 percent of voters plan to vote for Hillary Clinon and 37.5 percent plan to vote for Donald Trump. (The remaining 21.5 percent are undecided or plan to vote for another When broken down by gender, 49 percent of female voters and 33 percent of male voters plan to vote for Clinton. Meanwhile, 30 percent of female voters and 45 percent of male voters plan to vote for Trump. Assume the population is 50% female, 50% male. (http: //www.people-press.org/2016/08/18/1-voters-general-election-preferences/) 2a. Suppose we randomly survey 1000 people. Using the formula you learned in class, calculate the standard deviation of the proportion who support Clinton in such a sample. Now simulate such a sample: Create a vector clinton which represents whether those surveyed say they will vote for Clinton (the vector should have length 1000). Repeat the above for Trump. 2b. Suppose we sample 1000 people and it happens that 60 percent of those sampled are female and 40 peroent are male. Create vectors clinton.female and clinton.nale which simulate the responses of just the females and just the males in the sample. What is your resulting overall estimate of the proportion who will vote for Clinton? How different in percentage points) is it than your estimate from 2a? 2c. Suppose that we ensure that half of the 1000 surveyed are female and half male (as is true of the population as a whole). Use a simulation to calcualte the mean and standard deviation of the proportion that vote for Clinton Compare that to the mean and standard deviation, from part b
Step by Step Solution
There are 3 Steps involved in it

Get step-by-step solutions from verified subject matter experts