

Question: Using R output the code and the steps For the entirety of this section use the BostonHousing2 dataset. Make sure the mlbench library has been
 Using R output the code and the steps
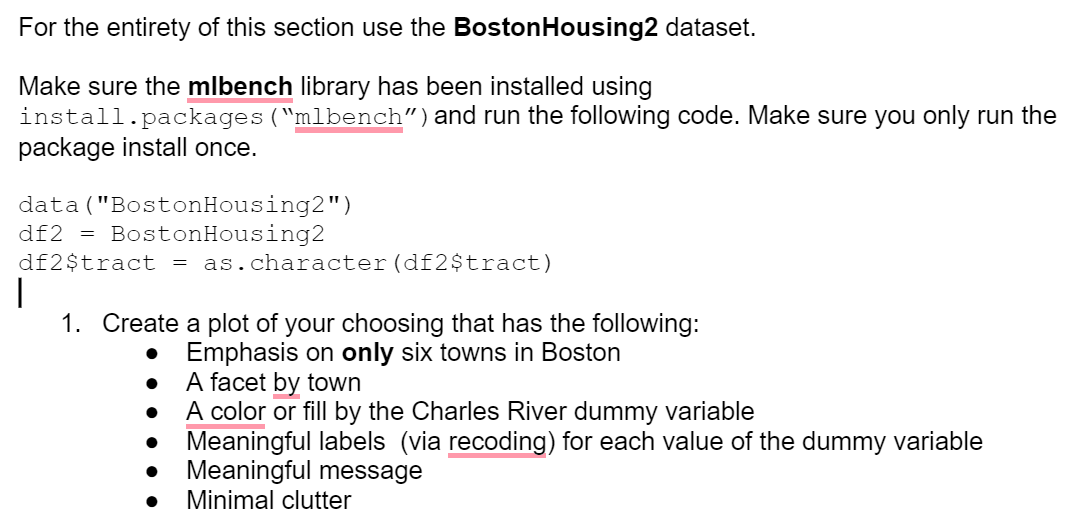
For the entirety of this section use the BostonHousing2 dataset. Make sure the mlbench library has been installed using install.packages ( "mlbench") and run the following code. Make sure you only run the package install once. data ("BostonHousing2") df2= BostonHousing 2 df2\$tract = as. character (df2\$tract) 1. Create a plot of your choosing that has the following: - Emphasis on only six towns in Boston - A facet by town - A color or fill by the Charles River dummy variable - Meaningful labels (via recoding) for each value of the dummy variable - Meaningful message - Minimal clutter
Step by Step Solution
There are 3 Steps involved in it
1 Expert Approved Answer
Step: 1 Unlock

Question Has Been Solved by an Expert!
Get step-by-step solutions from verified subject matter experts
Step: 2 Unlock
Step: 3 Unlock