

Question: Using R studio for this question using this dataset link: https://www.ers.usda.gov/data-products/cost-estimates-of-foodborne-illnesses/ Teach me how to use R studio to make 2 fancy graphs with this
Using R studio for this question using this dataset link: https://www.ers.usda.gov/data-products/cost-estimates-of-foodborne-illnesses/
Teach me how to use R studio to make 2 fancy graphs with this dataset and explain how it works and write a description of the data please put the R code for the answer
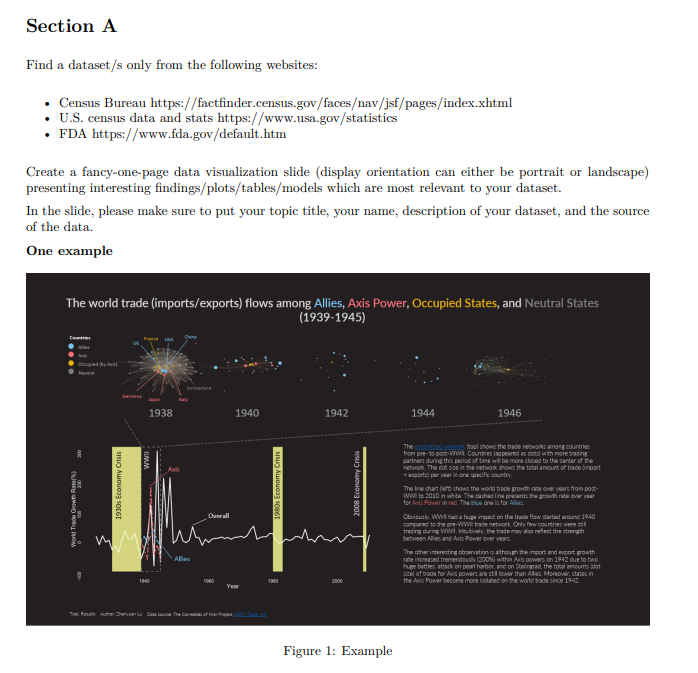
Find a dataset/s only from the following websites: - Census Bureau https://factfinder.census.gov/facesav/jsf/pages/index.xhtml - U.S. census data and stats https://www.usa.gov/statistics - FDA https://www.fda.gov/default.htm Create a fancy-one-page data visualization slide (display orientation can either be portrait or landscape) presenting interesting findings/plots/tables/models which are most relevant to your dataset. In the slide, please make sure to put your topic title, your name, description of your dataset, and the source of the data. One example Figure 1: Example
Step by Step Solution
There are 3 Steps involved in it

Get step-by-step solutions from verified subject matter experts