

Question: Using R studio programming language: The following data give the numbers of orders received for a sample of 30 hours at the Timesaver Mail Order
Using R studio programming language: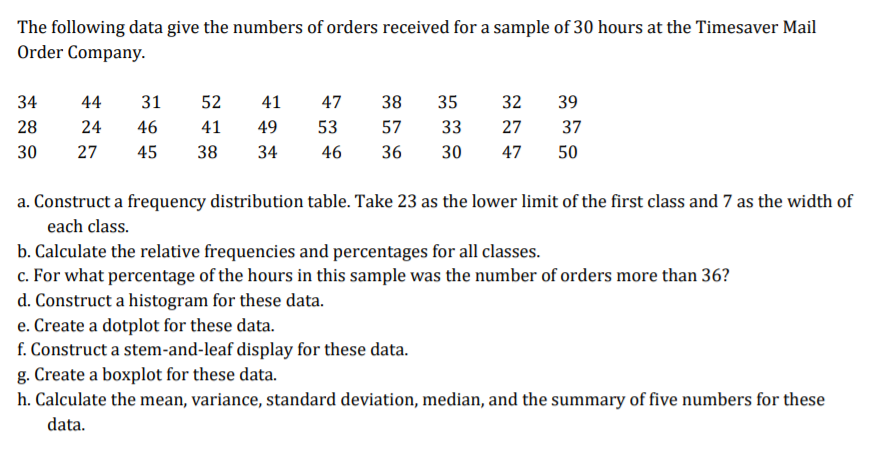
The following data give the numbers of orders received for a sample of 30 hours at the Timesaver Mail Order Company. 34 28 30 44 24 27 31 46 45 52 41 38 41 49 34 47 53 46 38 57 35 33 32 27 39 37 50 36 30 47 a. Construct a frequency distribution table. Take 23 as the lower limit of the first class and 7 as the width of each class. b. Calculate the relative frequencies and percentages for all classes. c. For what percentage of the hours in this sample was the number of orders more than 36? d. Construct a histogram for these data. e. Create a dotplot for these data. f. Construct a stem-and-leaf display for these data. g. Create a boxplot for these data. h. Calculate the mean, variance, standard deviation, median, and the summary of five numbers for these data. The following data give the numbers of orders received for a sample of 30 hours at the Timesaver Mail Order Company. 34 28 30 44 24 27 31 46 45 52 41 38 41 49 34 47 53 46 38 57 35 33 32 27 39 37 50 36 30 47 a. Construct a frequency distribution table. Take 23 as the lower limit of the first class and 7 as the width of each class. b. Calculate the relative frequencies and percentages for all classes. c. For what percentage of the hours in this sample was the number of orders more than 36? d. Construct a histogram for these data. e. Create a dotplot for these data. f. Construct a stem-and-leaf display for these data. g. Create a boxplot for these data. h. Calculate the mean, variance, standard deviation, median, and the summary of five numbers for these data
Step by Step Solution
There are 3 Steps involved in it

Get step-by-step solutions from verified subject matter experts