

Question: Using R to solve the question. Please provide a detailed solution. The data used for this problem is copied and pasted at the bottom. Alpine
Using R to solve the question. Please provide a detailed solution. The data used for this problem is copied and pasted at the bottom.
Alpine 14.1 .86 .9853 13.6 Benson&Hedges 16.0 1.06 1.0938 16.6 BullDurham 29.8 2.03 1.1650 23.5 CamelLights 8.0 .67 .9280 10.2 Carlton 4.1 .40 .9462 5.4 Chesterfield 15.0 1.04 .8885 15.0 GoldenLights 8.8 .76 1.0267 9.0 Kent 12.4 .95 .9225 12.3 Kool 16.6 1.12 .9372 16.3 L&M 14.9 1.02 .8858 15.4 LarkLights 13.7 1.01 .9643 13.0 Marlboro 15.1 .90 .9316 14.4 Merit 7.8 .57 .9705 10.0 MultiFilter 11.4 .78 1.1240 10.2 NewportLights 9.0 .74 .8517 9.5 Now 1.0 .13 .7851 1.5 OldGold 17.0 1.26 .9186 18.5 PallMallLight 12.8 1.08 1.0395 12.6 Raleigh 15.8 .96 .9573 17.5 SalemUltra 4.5 .42 .9106 4.9 Tareyton 14.5 1.01 1.0070 15.9 True 7.3 .61 .9806 8.5 ViceroyRichLight 8.6 .69 .9693 10.6 VirginiaSlims 15.2 1.02 .9496 13.9 WinstonLights 12.0 .82 1.1184 14.9
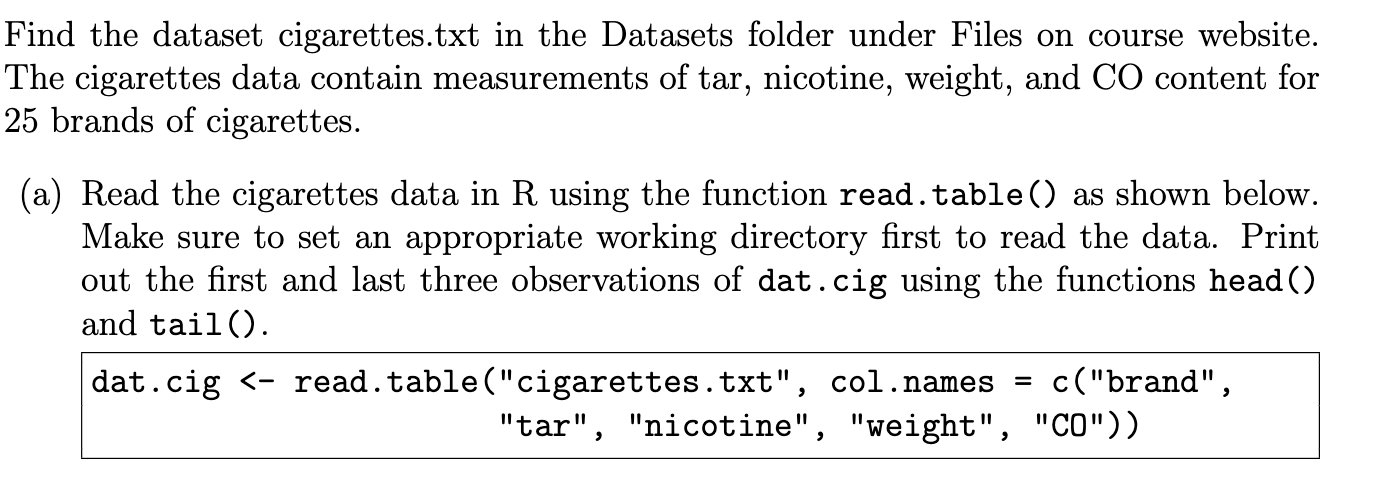
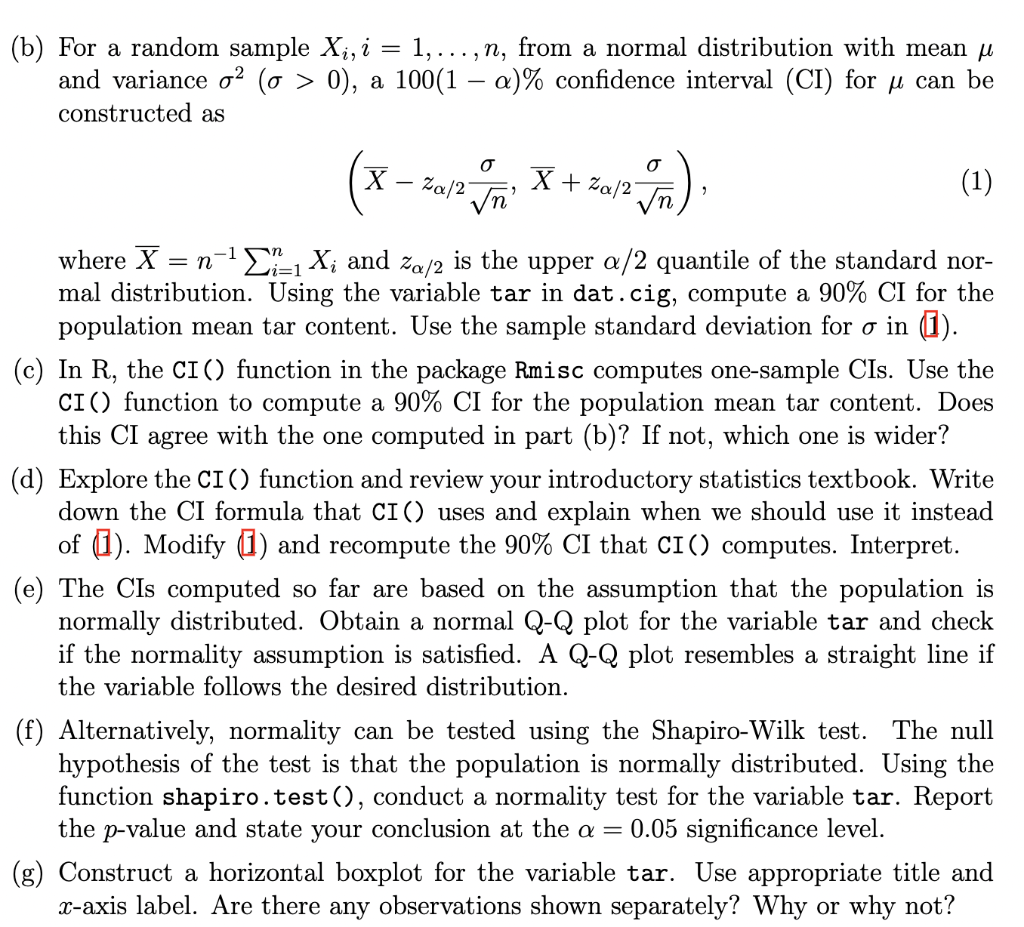
Find the dataset cigarettes.txt in the Datasets folder under Files on course website. The cigarettes data contain measurements of tar, nicotine, weight, and CO content for 25 brands of cigarettes. (a) Read the cigarettes data in R using the function read.table() as shown below. Make sure to set an appropriate working directory first to read the data. Print out the first and last three observations of dat.cig using the functions head() and tail(). dat.cig > = (b) For a random sample Xi, i = 1, ..., n, from a normal distribution with mean u and variance o2 (o > 0), a 100(1 a)% confidence interval (CI) for u can be constructed as o o X Zala p. X+za/2 mm) 2 Za (1) 7 v -1 n i . where X = n-1 L1=1 Xi and Za/2 the upper a/2 quantile of the standard nor- mal distribution. Using the variable tar in dat.cig, compute a 90% CI for the population mean tar content. Use the sample standard deviation for o in (1). (c) In R, the CI () function in the package Rmisc computes one-sample Cis. Use the CI() function to compute a 90% CI for the population mean tar content. Does this CI agree with the one computed in part (b)? If not, which one is wider? (d) Explore the CI () function and review your introductory statistics textbook. Write down the CI formula that CI () uses and explain when we should use it instead of 1). Modify (1) and recompute the 90% CI that CI() computes. Interpret. (e) The Cis computed so far are based on the assumption that the population is normally distributed. Obtain a normal Q-Q plot for the variable tar and check if the normality assumption is satisfied. A Q-Q plot resembles a straight line if the variable follows the desired distribution. (f) Alternatively, normality can be tested using the Shapiro-Wilk test. The null hypothesis of the test is that the population is normally distributed. Using the function shapiro.test(), conduct a normality test for the variable tar. Report the p-value and state your conclusion at the a = 0.05 significance level. (g) Construct a horizontal boxplot for the variable tar. Use appropriate title and x-axis label. Are there any observations shown separately? Why or why not
Step by Step Solution
There are 3 Steps involved in it

Get step-by-step solutions from verified subject matter experts