

Question: Using scipy and or libraries you need. 2. (5 Marks) (Heath, 2018) A planet follows an elliptical orbit, which can be represented in a Cartesian
Using scipy and or libraries you need.
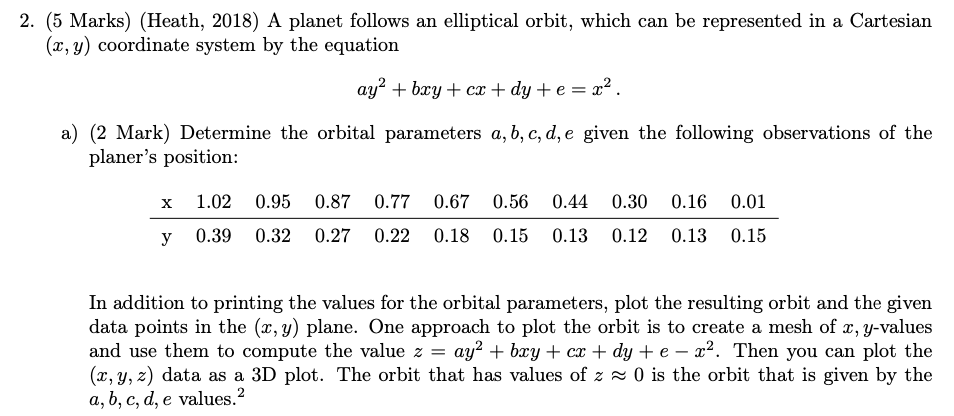
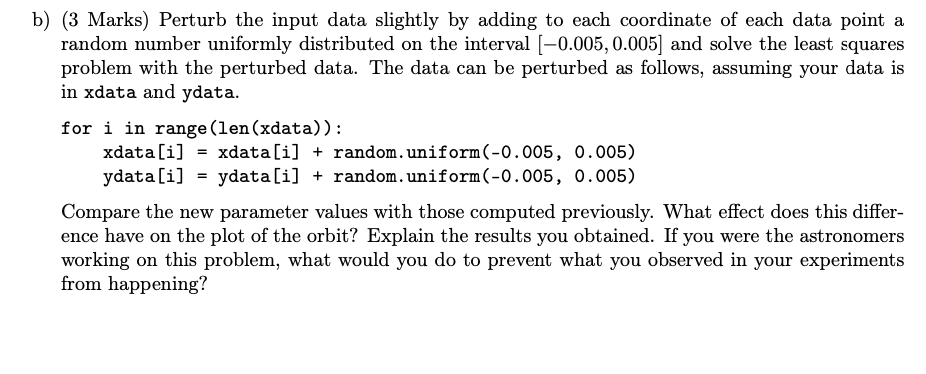
2. (5 Marks) (Heath, 2018) A planet follows an elliptical orbit, which can be represented in a Cartesian (x, y) coordinate system by the equation ay? + bxy + cx + dy +e= x2. a) (2 Mark) Determine the orbital parameters a, b, c, d, e given the following observations of the planer's position: X 1.02 0.95 0.87 0.77 0.67 0.56 0.44 0.30 0.16 0.01 0.39 0.32 0.27 0.22 0.18 0.15 0.13 0.12 0.13 0.15 In addition to printing the values for the orbital parameters, plot the resulting orbit and the given data points in the (x, y) plane. One approach to plot the orbit is to create a mesh of x, y-values and use them to compute the value z = ay2 + bxy + cx + dy + e - 22. Then you can plot the (x, y, z) data as a 3D plot. The orbit that has values of z = 0 is the orbit that is given by the a, b, c, d, e values. 2 b) (3 Marks) Perturb the input data slightly by adding to each coordinate of each data point a random number uniformly distributed on the interval (-0.005, 0.005] and solve the least squares problem with the perturbed data. The data can be perturbed as follows, assuming your data is in xdata and ydata. for i in range (len(xdata)): xdata[i] = xdata[i] + random.uniform(-0.005, 0.005) ydata[i] = ydata[i] + random.uniform(-0.005, 0.005) Compare the new parameter values with those computed previously. What effect does this differ- ence have on the plot of the orbit? Explain the results you obtained. If you were the astronomers working on this problem, what would you do to prevent what you observed in your experiments from happening? 2. (5 Marks) (Heath, 2018) A planet follows an elliptical orbit, which can be represented in a Cartesian (x, y) coordinate system by the equation ay? + bxy + cx + dy +e= x2. a) (2 Mark) Determine the orbital parameters a, b, c, d, e given the following observations of the planer's position: X 1.02 0.95 0.87 0.77 0.67 0.56 0.44 0.30 0.16 0.01 0.39 0.32 0.27 0.22 0.18 0.15 0.13 0.12 0.13 0.15 In addition to printing the values for the orbital parameters, plot the resulting orbit and the given data points in the (x, y) plane. One approach to plot the orbit is to create a mesh of x, y-values and use them to compute the value z = ay2 + bxy + cx + dy + e - 22. Then you can plot the (x, y, z) data as a 3D plot. The orbit that has values of z = 0 is the orbit that is given by the a, b, c, d, e values. 2 b) (3 Marks) Perturb the input data slightly by adding to each coordinate of each data point a random number uniformly distributed on the interval (-0.005, 0.005] and solve the least squares problem with the perturbed data. The data can be perturbed as follows, assuming your data is in xdata and ydata. for i in range (len(xdata)): xdata[i] = xdata[i] + random.uniform(-0.005, 0.005) ydata[i] = ydata[i] + random.uniform(-0.005, 0.005) Compare the new parameter values with those computed previously. What effect does this differ- ence have on the plot of the orbit? Explain the results you obtained. If you were the astronomers working on this problem, what would you do to prevent what you observed in your experiments from happening
Step by Step Solution
There are 3 Steps involved in it

Get step-by-step solutions from verified subject matter experts