

Question: Using simple exponential smoothing and the following time series data, respond to each of the items. table [ [ Period , Demand ] ,
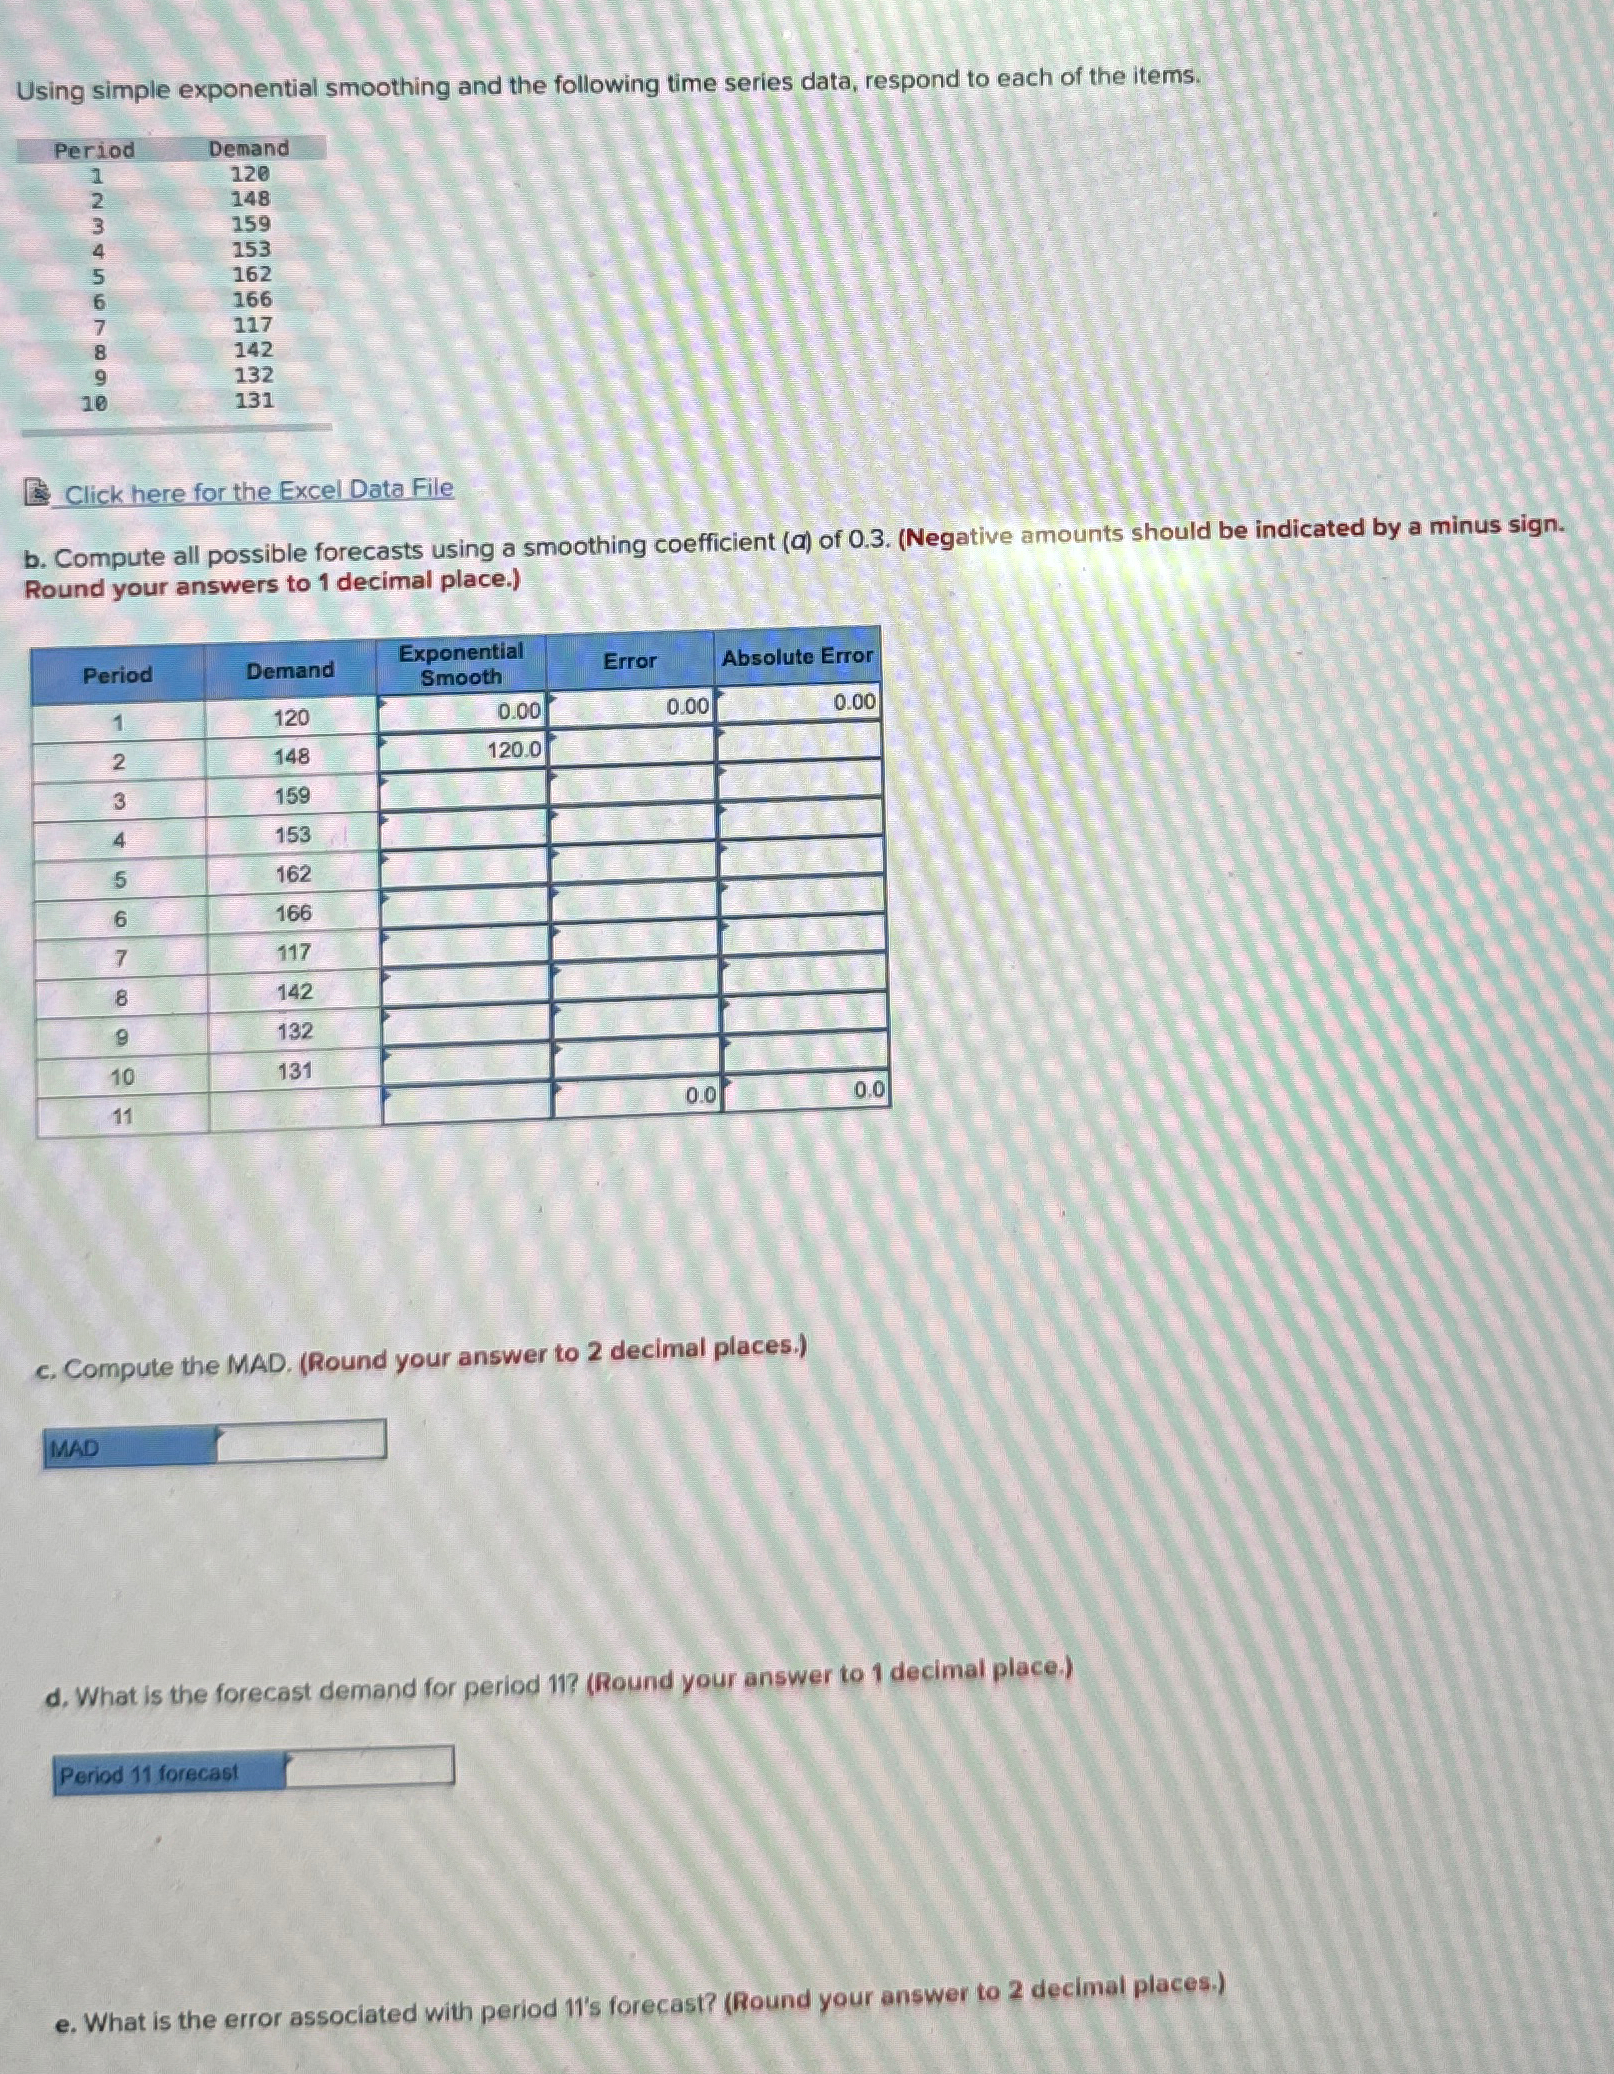
Using simple exponential smoothing and the following time series data, respond to each of the items.
tablePeriodDemand
Click here for the Excel Data File
b Compute all possible forecasts using a smoothing coefficient a of Negative amounts should be indicated by a minus sign. Round your answers to decimal place.
tablePeriodDemand,tableExponentialSmoothError,Absolute Error
c Compute the MAD. Round your answer to decimal places.
MAD
d What is the forecast demand for period Round your answer to decimal place.
Period forecast
e What is the error associated with period s forecast? Round your answer to decimal places.
Step by Step Solution
There are 3 Steps involved in it
1 Expert Approved Answer
Step: 1 Unlock

Question Has Been Solved by an Expert!
Get step-by-step solutions from verified subject matter experts
Step: 2 Unlock
Step: 3 Unlock