

Question: Using SPSS, perform the appropriate statistical analysis for the given problem. 1. The following data represent the responses to two questions asked in a survey
Using SPSS, perform the appropriate statistical analysis for the given problem.
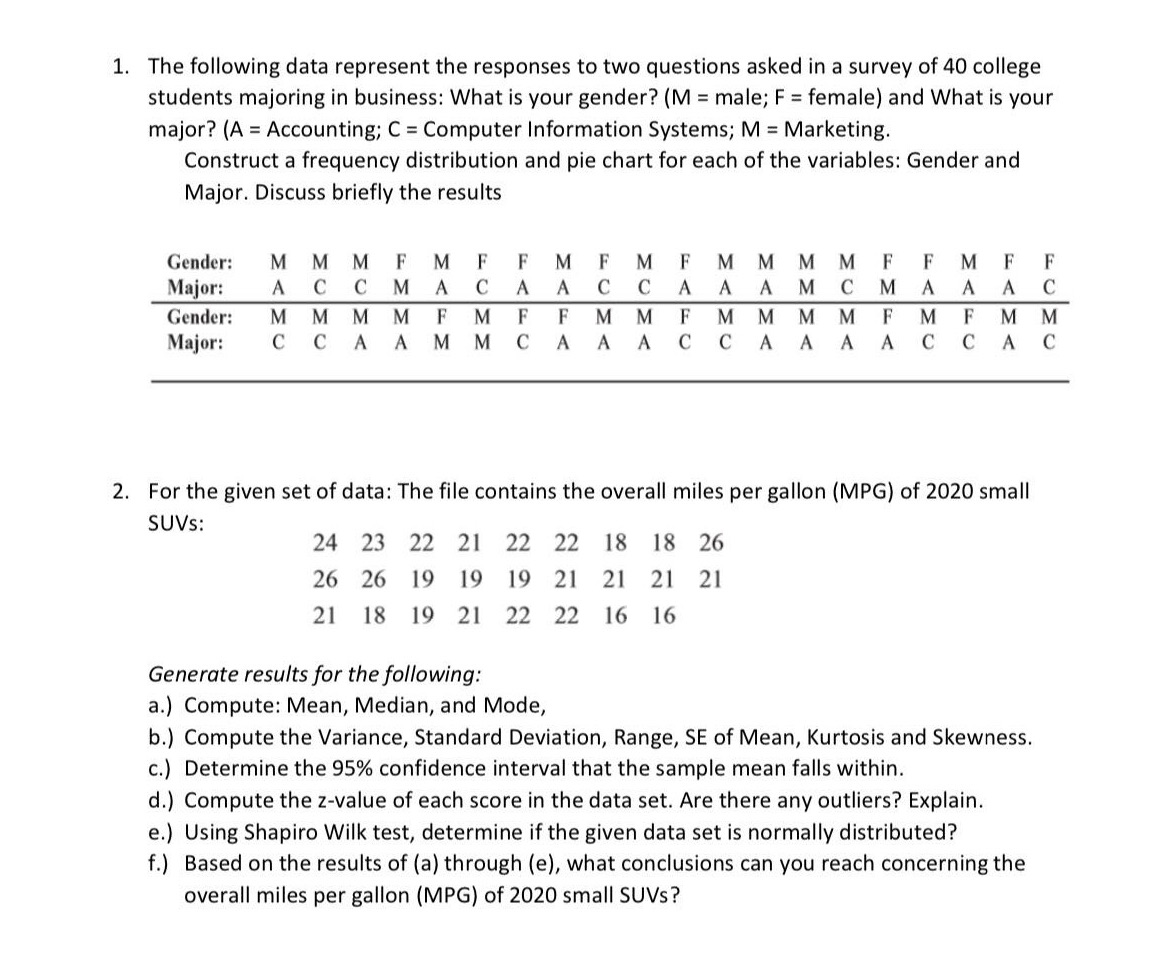
1. The following data represent the responses to two questions asked in a survey of 40 college students majoring in business: What is your gender? (M = male; F = female) and What is your major? (A = Accounting; C = Computer Information Systems; M = Marketing. Construct a frequency distribution and pie chart for each of the variables: Gender and Major. Discuss briefly the results Gender M M M F M F F M F M F M M M M F F M F F Major. A C C M A C A A C C A A A M C M A A A C Gender: M M M M F M F F M M F M M M M F M F M M Major C C A A M M C A A A C C A A A A C C A C 2. For the given set of data: The file contains the overall miles per gallon (MPG) of 2020 small SUVs: 24 23 22 21 22 22 18 18 26 26 26 l9 19 19 2| 21 21 21 21 18 I9 21 22 22 I6 16 Generate results for the following: a.) Compute: Mean, Median, and Mode, b.) Compute the Variance, Standard Deviation, Range, SE of Mean, Kurtosis and Skewness. c.) Determine the 95% confidence interval that the sample mean falls within. d.) Compute the z-value of each score in the data set. Are there any outliers? Explain. e.) Using Shapiro Will: test, determine if the given data set is normally distributed? f.) Based on the results of (a) through (e), what conclusions can you reach concerning the overall miles per gallon (MPG) of 2020 small SUVs
Step by Step Solution
There are 3 Steps involved in it

Get step-by-step solutions from verified subject matter experts