

Question: Using SPSS show your steps: Using the dataset below, construct a clustered bar graph examining the relationship between Skills score (dependent variable) and Marital and
Using SPSS show your steps:
Using the dataset below, construct a clustered bar graph examining the relationship between Skills score (dependent variable) and Marital and Sex (independent variables). Make sure you classify both Sex and Marital as nominal variables.
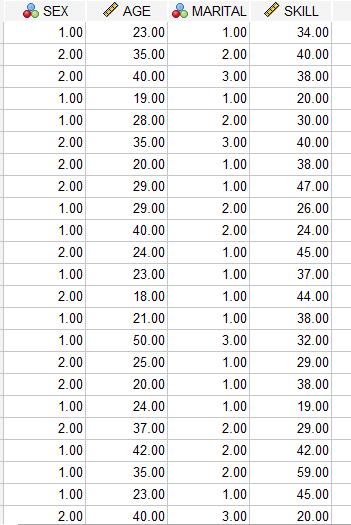
SEX 1.00 2.00 2.00 1.00 1.00 2.00 2.00 2.00 1.00 1.00 2.00 1.00 2.00 1.00 1.00 2.00 2.00 1.00 2.00 1.00 1.00 1.00 2.00 COPA AGE 23.00 35.00 40.00 19.00 28.00 35.00 20.00 29.00 29.00 40.00 24.00 23.00 18.00 21.00 50.00 25.00 20.00 24.00 37.00 42.00 35.00 23.00 40.00 MARITAL 1.00 2.00 3.00 1.00 2.00 3.00 1.00 1.00 2.00 2.00 1.00 1.00 1.00 1.00 3.00 1.00 1.00 1.00 2.00 2.00 2.00 1.00 3.00 CO SKILL 34.00 40.00 38.00 20.00 30.00 40.00 38.00 47.00 26.00 24.00 45.00 37.00 44.00 38.00 32.00 29.00 38.00 19.00 29.00 42.00 59.00 45.00 20.00
Step by Step Solution
There are 3 Steps involved in it

Get step-by-step solutions from verified subject matter experts