

Question: Using SQL, how to solve this? 3.2 Joining and Mapping We will now use of this code and libraries to plot the map of North
Using SQL, how to solve this?
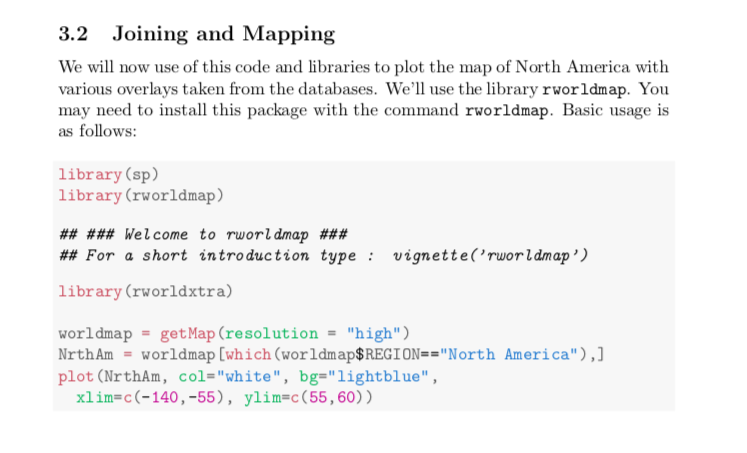
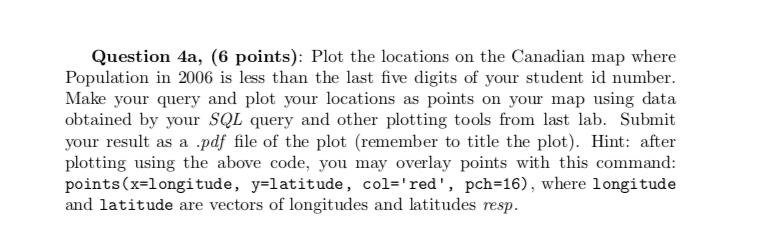
3.2 Joining and Mapping We will now use of this code and libraries to plot the map of North America with various overlays taken from the databases. We'll use the library rworldmap. You may need to install this package with the command rworldmap. Basic usage is as follows: library (sp) library (rworldmap) ## ### Welcome to rworldmap ### ## For a short introduction type : vignette('rworldmap') library (rworldxtra) worldmap = get Map (resolution = "high") Nrth Am = worldmap [which (worldmap$REGION=="North America"),] plot (NrthAm, col="white", bg="lightblue", xlim=c(-140, -55), ylim=c(55,60)) Question 4a, 6 points): Plot the locations on the Canadian map where Population in 2006 is less than the last five digits of your student id number. Make your query and plot your locations as points on your map using data obtained by your SQL query and other plotting tools from last lab. Submit your result as a .pdf file of the plot (remember to title the plot). Hint: after plotting using the above code, you may overlay points with this command: points(x=longitude, y=latitude, col='red', pch=16), where longitude and latitude are vectors of longitudes and latitudes resp. 3.2 Joining and Mapping We will now use of this code and libraries to plot the map of North America with various overlays taken from the databases. We'll use the library rworldmap. You may need to install this package with the command rworldmap. Basic usage is as follows: library (sp) library (rworldmap) ## ### Welcome to rworldmap ### ## For a short introduction type : vignette('rworldmap') library (rworldxtra) worldmap = get Map (resolution = "high") Nrth Am = worldmap [which (worldmap$REGION=="North America"),] plot (NrthAm, col="white", bg="lightblue", xlim=c(-140, -55), ylim=c(55,60)) Question 4a, 6 points): Plot the locations on the Canadian map where Population in 2006 is less than the last five digits of your student id number. Make your query and plot your locations as points on your map using data obtained by your SQL query and other plotting tools from last lab. Submit your result as a .pdf file of the plot (remember to title the plot). Hint: after plotting using the above code, you may overlay points with this command: points(x=longitude, y=latitude, col='red', pch=16), where longitude and latitude are vectors of longitudes and latitudes resp
Step by Step Solution
There are 3 Steps involved in it

Get step-by-step solutions from verified subject matter experts