

Question: Using Tables below, compare and contrast the Planned Shipment Schedule if the Distribution Requirements Plan is made using initially normal DRP process and then
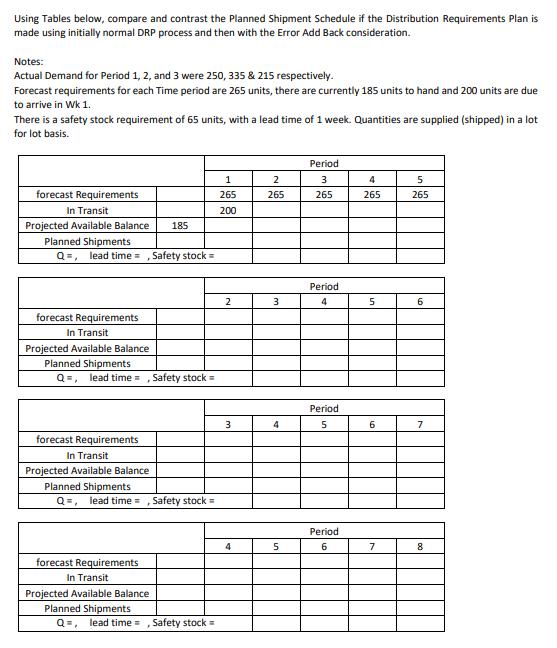
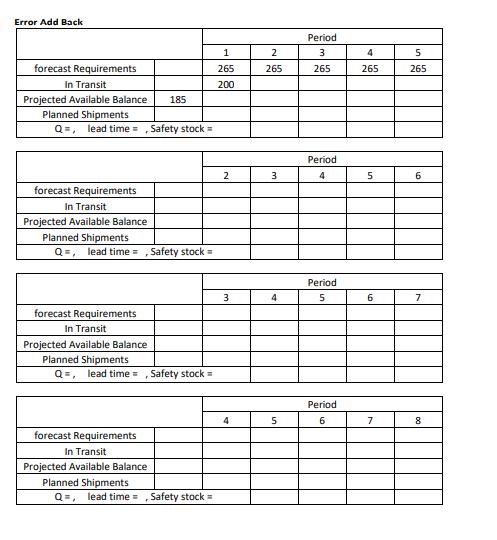
Using Tables below, compare and contrast the Planned Shipment Schedule if the Distribution Requirements Plan is made using initially normal DRP process and then with the Error Add Back consideration. Notes: Actual Demand for Period 1, 2, and 3 were 250, 335 & 215 respectively. Forecast requirements for each Time period are 265 units, there are currently 185 units to hand and 200 units are due to arrive in Wk 1. There is a safety stock requirement of 65 units, with a lead time of 1 week. Quantities are supplied (shipped) in a lot for lot basis. forecast Requirements In Transit Projected Available Balance 185 Planned Shipments Q=, lead time = , Safety stock = forecast Requirements In Transit Projected Available Balance Planned Shipments Q=, lead time=, Safety stock = forecast Requirements In Transit Projected Available Balance Planned Shipments Q=, lead time=, Safety stock = forecast Requirements In Transit Projected Available Balance Planned Shipments Q=, lead time=, Safety stock = 1 265 200 2 3 4 2 265 3 4 5 Period 3 265 Period 4 Period 5 Period 6 4 265 5 6 7 5 265 6 7 8 Error Add Back forecast Requirements In Transit Projected Available Balance 185 Planned Shipments Q=, lead time=, Safety stock = forecast Requirements In Transit Projected Available Balance Planned Shipments Q=, lead time = , Safety stock = forecast Requirements In Transit Projected Available Balance Planned Shipments Q=, lead time=, Safety stock = forecast Requirements In Transit Projected Available Balance : Planned Shipments Q =, lead time, Safety stock = 1 265 200 2 3 4 2 265 3 4 5 Period 3 265 Period 4 Period 5 Period 6 4 265 5 6 7 5 265 6 7 8
Step by Step Solution
There are 3 Steps involved in it

Get step-by-step solutions from verified subject matter experts