

Question: Using the 4 pro forma excel sheets, help answer the following questions Please show work/formulas in excel. D 6 M N 1 2 2 1.
Using the 4 pro forma excel sheets, help answer the following questions
Please show work/formulas in excel.
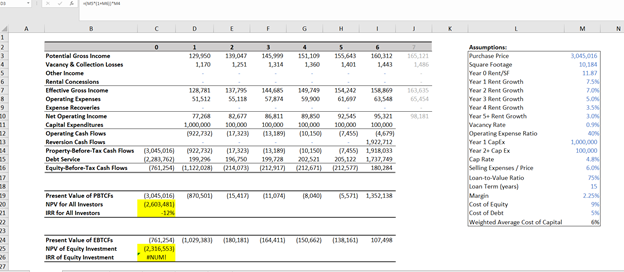
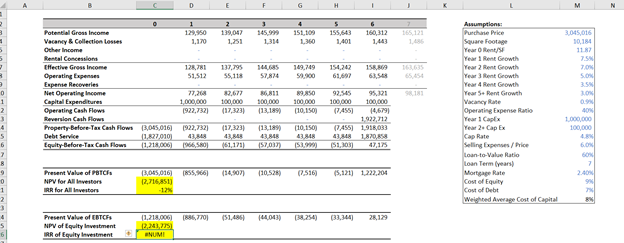
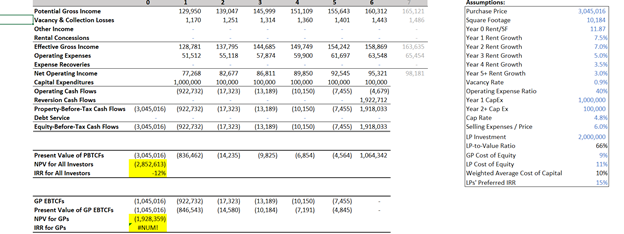
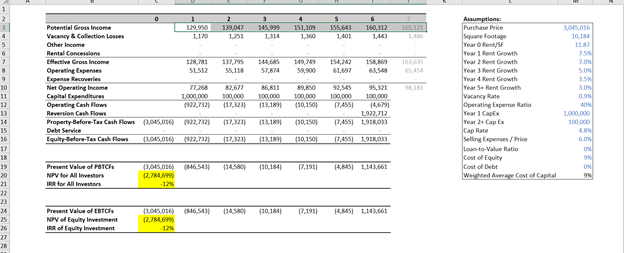
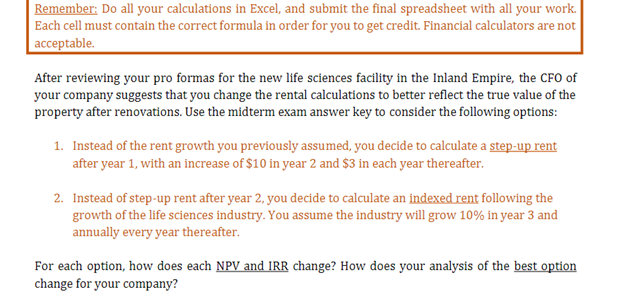
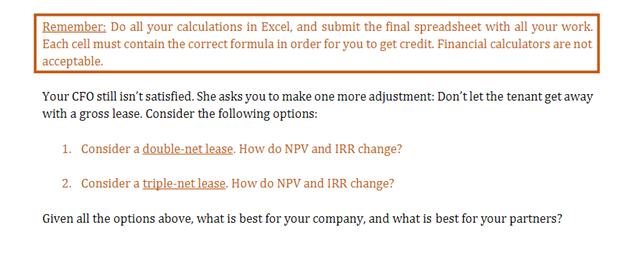
D 6 M N 1 2 2 1. 1251 3 145,9) 1,314 4 151,109 1.30 5 155,543 165.121 160, 312 1.443 30.016 11 7.5% GES 144, SAM 55.118 149,709 59.900 154.242 6169 15.109 63.58 0 1 Potential Grous Income 129,90 Vacancy & Collection losses 1,170 Other Income Rental Concessions Effective Gross income 128,71 Operating Expenses 51,512 Expense Recoveries Net Operating Income 77,200 Capital Expenditures 1,000,000 Operating Cash Flows 1922,7321 Reversion Cash Flows Property Before-Tex Cash Flows 3,045,016) (922,7321 Debt Service 12,283, 7021 199.96 Equity Before-Tex Cash Flow (761,254) (1.122,028 S181 SON 3.5 1.00 0.9 82677 100.000 117,323) 6811 100,000 (13,189) 89,50 100.000 (10,1501 Assumption Purchase Price Square footage Year Rent Year 1 Rent Growth Year 2 Rent Growth Year 3 Rent Growth Year 4 Rent Growth Year 5 Rent Growth Vacancy Rate Operating Expense Ratio Year 1 Capex Year 2 Cap Ex Cap Rate Selling Expenses Price Loan-to-Value Ratio Loan Term (years) Cost of Equity Cost of Debt Weighted Average cost of capital 1.000.000 100.000 (17,323) 100.000 100,000 (1.455) 14,679) 1977,712 (7.455) 191,033 205 122 1.737.749 212,527 180,284 (1310 (10,1501 200,521 (212,673) (214073) 212,917) 27 6.03 75 15 2.25 (870,501) (15.417 (11,074 IRO (5,571) 1,352,138 Present Value of PBTCFS NPV for All Investors IRR for All Investors (3.045,016 12,603,4811 -13 5 AN 24 (180.181) (164,411) (150,662) (1.161) 101.498 Present Value of ETC. NPV of Equity Investment IRR of Equity Investment (761,254 (1029.1811 2.316,5531 INUMI 6 H 2 139,047 1.251 3 145,999 1314 4 151,109 1.360 5 155,643 1.401 6 160,112 1.443 7 165121 3.045,016 10,11 11 7.5 154,242 137,795 55.118 52.814 149.749 51,900 158,869 63.54 S. Potential Gross Income 129,950 Vacany & Collection losses 1.170 Other Income Rental Concession Effective Gross Income 128,71 Operating Expenses 51,512 Expense Recoveries Net Operating Income 77,268 Capital Expenditures 1,000,000 Operating Cash Flows 1922,732] Reversion Cash Flow Property Before-Tex Cash Flows 3,045,016) 1922,7321 Debt Service 1.8270101 Equity Before-Tex Cash Flows (1,318,006) (960, 5001 82.677 100,000 (17,1231 B6811 100.000 (13.189 89250 100.000 110,150) 92.545 95.22 100,000 100,000 (7455 14,6791 1923,212 7,455) 1,910,033 43,48 1,870,858 (51,303) 47,175 Asumptions: Purchase Price Square footage Year Rent Year 1 Rent Growth Year 2 Rent Growth Year 3 Rent Growth Year 4 Rent Growth Year 5 Bert Growth Vacancy Rate Operating Expense Ratio Year 1 Cape Year 2. Cap Ex Cap Rate Selling Expenses Price Loan-to-Value Ratio Loan Term (years) Mortgage Rate Cost of Equity Cost of Debt Weighted Average cost of Capital LO 09 40% 1,000,000 100,000 (17,323) 113,189 43 MB 157,037 110,150 M 151 161,171) GON 7 1855,966) (14,507 110.5289 (7.516) 13,065,016) 12,716,851) Present Value of PTCH NPV for All investors RR for All Investors 5,121 1222,2014 1896, 770 (51,4861 (44,043) 38.254) (33,3441 28, 129 Present Value of EBTCF NPV of Equity Investment IRR of Ecully lavestment 11,218,000 2,241,725 NUMI 145.999 151,109 165.121 129,950 1.170 119,047 1251 155,64) 1.401 160.312 1.443 12,781 51,512 137,795 55,118 1446 57.8 149,749 59,900 154,2 61,697 158 63,548 Potential Gross Income Vacancy & Collection Losses Other Income Rental Concessions Effective Gross Income Operating Expenses Expense Recoveries Net Operating Income Capital Expenditures Operating Cash Flows Reversion Cash Flows Property Before-Tex Cash Flows 3,045,016) Debt Service Equity Before-Tex Cash Flow 13.045,016) 3,045,016 10,134 11.07 7.5 7. SON 3.5 3. 0.9 65.454 98,181 77,258 1,000,000 1922.732) 82.677 100.000 (17.323) 86,811 300,000 (13.10 89,850 100,000 (10,150 92,545 95.321 100,000 100.000 17.455 (4629) 1922 212 17.455) 1.918033 Amumptions Purchase Price Square footage Year Rent/SF Year 1 Rent Geowth Year 2 Rent Geowth Year 3 Rent Geowth Year 4 Rent Growth Year St Remi Growth Vacancy Rate Operating Expense Ratio Year 1 Captx Year - Cap Ex Cap Rate Selling Expenses/Price LP Investment P-to-Value Ratio GP Cont of Equity Up Cost of Equity Weighted Average Cost of Capital LPS Preferred IRR 1922.732 (17,3231 113,1891 (10,1500 1922,732 (1733) (13,189) (10,150) 17.455) 1918.033 1,000,000 100,000 4.8 60W 2,000,000 66 9 11 10 15 (14.2351 16,854) 14.564) 1064342 Present Value of PBTC NPV for All Investors IRR for All Investors (3,045,016) 836,4 12,852,613) (1.045,016) 1922.732 (1,045,016) 1946,54% (1.928,359 NUMI (17.323) (14.5801 (11.189) 110,111 GP EBTCF Present Value of GP EBTC NPV for GP RR for GPS (10,1501 17.191) 17.455) 14.845 2 139,047 11 3 145,999 1.314 4 151,109 1.160 5 155,643 1,401 6 160,312 165,121 14465 57,874 149,0) 59,900 154,242 15 63,548 55,118 0 Potential Gross income 129.950 Vacancy & Collection Lores 1.110 Other Income Rental Convensions Elective Gros Income 126781 Operating Expenses 51,512 Expense Recoveries Net Operating Income 72.28 Capital Expenditures 1.000.000 Operating Cash Flows 22.732) Reversion Cash Flows Property Before-Tex Cash Flows (3,045,016) 22.732) Debt Service Equity Before-Tex Cash Flows 0,00010 1922.732) 10 82,677 100 000 117,3231 86,811 100,000 (13,189) 89,850 100.000 (30,150 92,545 95,321 100,000 100,000 17,4551 14,679 1922,212 17.455 1956,033 Asumptions: Purchase Price Square footage Year Rent/SF Year Rent Growth Year 2 Rent Growth Year 3 Rent Growth Year 4 Rent Growth Year St Rent Growth Vacancy Rate Operating Expense Ratio Year 1 Capex Year 2. Cap Ex Cap Rate Selling Expenses Price Loan-to-Value Ratio Cost of Equity Cost of Debt Weighted Average Cost od Capital 3,045 016 10.14 1187 75 2.0 SON 15 3.0 09 40% 1.000.000 300.000 4 60 ON 9 OX 9 (17,323 (131) (30,150 (17.12 (22.10 (30,1501 17,455 101RONI (846 553 11450 (10,184) 17,1911 12 13 14 15 16 17 18 19 20 21 22 23 24 25 26 27 28 14,845 1143,661 Present Value of PATCH NPV for All Investors I for All Investors (3,045,086) 12,784,6991 -12 (14.580 (10,184 07.1991 Present Value of EOTCH NPV of Equity Investment IRR od Equity Investment (3,085.036) 846503) 12,784,6991 - 12 Remember: Do all your calculations in Excel, and submit the final spreadsheet with all your work. Each cell must contain the correct formula in order for you to get credit. Financial calculators are not acceptable. After reviewing your pro formas for the new life sciences facility in the Inland Empire, the CFO of your company suggests that you change the rental calculations to better reflect the true value of the property after renovations. Use the midterm exam answer key to consider the following options: 1. Instead of the rent growth you previously assumed, you decide to calculate a step-up rent after year 1, with an increase of $10 in year 2 and $3 in each year thereafter. 2. Instead of step-up rent after year 2, you decide to calculate an indexed rent following the growth of the life sciences industry. You assume the industry will grow 10% in year 3 and annually every year thereafter. For each option, how does each NPV and IRR change? How does your analysis of the best option change for your company? Remember: Do all your calculations in Excel, and submit the final spreadsheet with all your work. Each cell must contain the correct formula in order for you to get credit. Financial calculators are not acceptable. Your CFO still isn't satisfied. She asks you to make one more adjustment: Don't let the tenant get away with a gross lease. Consider the following options: 1. Consider a double-net lease. How do NPV and IRR change? 2. Consider a triple-net lease. How do NPV and IRR change? Given all the options above, what is best for your company, and what is best for your partners? D 6 M N 1 2 2 1. 1251 3 145,9) 1,314 4 151,109 1.30 5 155,543 165.121 160, 312 1.443 30.016 11 7.5% GES 144, SAM 55.118 149,709 59.900 154.242 6169 15.109 63.58 0 1 Potential Grous Income 129,90 Vacancy & Collection losses 1,170 Other Income Rental Concessions Effective Gross income 128,71 Operating Expenses 51,512 Expense Recoveries Net Operating Income 77,200 Capital Expenditures 1,000,000 Operating Cash Flows 1922,7321 Reversion Cash Flows Property Before-Tex Cash Flows 3,045,016) (922,7321 Debt Service 12,283, 7021 199.96 Equity Before-Tex Cash Flow (761,254) (1.122,028 S181 SON 3.5 1.00 0.9 82677 100.000 117,323) 6811 100,000 (13,189) 89,50 100.000 (10,1501 Assumption Purchase Price Square footage Year Rent Year 1 Rent Growth Year 2 Rent Growth Year 3 Rent Growth Year 4 Rent Growth Year 5 Rent Growth Vacancy Rate Operating Expense Ratio Year 1 Capex Year 2 Cap Ex Cap Rate Selling Expenses Price Loan-to-Value Ratio Loan Term (years) Cost of Equity Cost of Debt Weighted Average cost of capital 1.000.000 100.000 (17,323) 100.000 100,000 (1.455) 14,679) 1977,712 (7.455) 191,033 205 122 1.737.749 212,527 180,284 (1310 (10,1501 200,521 (212,673) (214073) 212,917) 27 6.03 75 15 2.25 (870,501) (15.417 (11,074 IRO (5,571) 1,352,138 Present Value of PBTCFS NPV for All Investors IRR for All Investors (3.045,016 12,603,4811 -13 5 AN 24 (180.181) (164,411) (150,662) (1.161) 101.498 Present Value of ETC. NPV of Equity Investment IRR of Equity Investment (761,254 (1029.1811 2.316,5531 INUMI 6 H 2 139,047 1.251 3 145,999 1314 4 151,109 1.360 5 155,643 1.401 6 160,112 1.443 7 165121 3.045,016 10,11 11 7.5 154,242 137,795 55.118 52.814 149.749 51,900 158,869 63.54 S. Potential Gross Income 129,950 Vacany & Collection losses 1.170 Other Income Rental Concession Effective Gross Income 128,71 Operating Expenses 51,512 Expense Recoveries Net Operating Income 77,268 Capital Expenditures 1,000,000 Operating Cash Flows 1922,732] Reversion Cash Flow Property Before-Tex Cash Flows 3,045,016) 1922,7321 Debt Service 1.8270101 Equity Before-Tex Cash Flows (1,318,006) (960, 5001 82.677 100,000 (17,1231 B6811 100.000 (13.189 89250 100.000 110,150) 92.545 95.22 100,000 100,000 (7455 14,6791 1923,212 7,455) 1,910,033 43,48 1,870,858 (51,303) 47,175 Asumptions: Purchase Price Square footage Year Rent Year 1 Rent Growth Year 2 Rent Growth Year 3 Rent Growth Year 4 Rent Growth Year 5 Bert Growth Vacancy Rate Operating Expense Ratio Year 1 Cape Year 2. Cap Ex Cap Rate Selling Expenses Price Loan-to-Value Ratio Loan Term (years) Mortgage Rate Cost of Equity Cost of Debt Weighted Average cost of Capital LO 09 40% 1,000,000 100,000 (17,323) 113,189 43 MB 157,037 110,150 M 151 161,171) GON 7 1855,966) (14,507 110.5289 (7.516) 13,065,016) 12,716,851) Present Value of PTCH NPV for All investors RR for All Investors 5,121 1222,2014 1896, 770 (51,4861 (44,043) 38.254) (33,3441 28, 129 Present Value of EBTCF NPV of Equity Investment IRR of Ecully lavestment 11,218,000 2,241,725 NUMI 145.999 151,109 165.121 129,950 1.170 119,047 1251 155,64) 1.401 160.312 1.443 12,781 51,512 137,795 55,118 1446 57.8 149,749 59,900 154,2 61,697 158 63,548 Potential Gross Income Vacancy & Collection Losses Other Income Rental Concessions Effective Gross Income Operating Expenses Expense Recoveries Net Operating Income Capital Expenditures Operating Cash Flows Reversion Cash Flows Property Before-Tex Cash Flows 3,045,016) Debt Service Equity Before-Tex Cash Flow 13.045,016) 3,045,016 10,134 11.07 7.5 7. SON 3.5 3. 0.9 65.454 98,181 77,258 1,000,000 1922.732) 82.677 100.000 (17.323) 86,811 300,000 (13.10 89,850 100,000 (10,150 92,545 95.321 100,000 100.000 17.455 (4629) 1922 212 17.455) 1.918033 Amumptions Purchase Price Square footage Year Rent/SF Year 1 Rent Geowth Year 2 Rent Geowth Year 3 Rent Geowth Year 4 Rent Growth Year St Remi Growth Vacancy Rate Operating Expense Ratio Year 1 Captx Year - Cap Ex Cap Rate Selling Expenses/Price LP Investment P-to-Value Ratio GP Cont of Equity Up Cost of Equity Weighted Average Cost of Capital LPS Preferred IRR 1922.732 (17,3231 113,1891 (10,1500 1922,732 (1733) (13,189) (10,150) 17.455) 1918.033 1,000,000 100,000 4.8 60W 2,000,000 66 9 11 10 15 (14.2351 16,854) 14.564) 1064342 Present Value of PBTC NPV for All Investors IRR for All Investors (3,045,016) 836,4 12,852,613) (1.045,016) 1922.732 (1,045,016) 1946,54% (1.928,359 NUMI (17.323) (14.5801 (11.189) 110,111 GP EBTCF Present Value of GP EBTC NPV for GP RR for GPS (10,1501 17.191) 17.455) 14.845 2 139,047 11 3 145,999 1.314 4 151,109 1.160 5 155,643 1,401 6 160,312 165,121 14465 57,874 149,0) 59,900 154,242 15 63,548 55,118 0 Potential Gross income 129.950 Vacancy & Collection Lores 1.110 Other Income Rental Convensions Elective Gros Income 126781 Operating Expenses 51,512 Expense Recoveries Net Operating Income 72.28 Capital Expenditures 1.000.000 Operating Cash Flows 22.732) Reversion Cash Flows Property Before-Tex Cash Flows (3,045,016) 22.732) Debt Service Equity Before-Tex Cash Flows 0,00010 1922.732) 10 82,677 100 000 117,3231 86,811 100,000 (13,189) 89,850 100.000 (30,150 92,545 95,321 100,000 100,000 17,4551 14,679 1922,212 17.455 1956,033 Asumptions: Purchase Price Square footage Year Rent/SF Year Rent Growth Year 2 Rent Growth Year 3 Rent Growth Year 4 Rent Growth Year St Rent Growth Vacancy Rate Operating Expense Ratio Year 1 Capex Year 2. Cap Ex Cap Rate Selling Expenses Price Loan-to-Value Ratio Cost of Equity Cost of Debt Weighted Average Cost od Capital 3,045 016 10.14 1187 75 2.0 SON 15 3.0 09 40% 1.000.000 300.000 4 60 ON 9 OX 9 (17,323 (131) (30,150 (17.12 (22.10 (30,1501 17,455 101RONI (846 553 11450 (10,184) 17,1911 12 13 14 15 16 17 18 19 20 21 22 23 24 25 26 27 28 14,845 1143,661 Present Value of PATCH NPV for All Investors I for All Investors (3,045,086) 12,784,6991 -12 (14.580 (10,184 07.1991 Present Value of EOTCH NPV of Equity Investment IRR od Equity Investment (3,085.036) 846503) 12,784,6991 - 12 Remember: Do all your calculations in Excel, and submit the final spreadsheet with all your work. Each cell must contain the correct formula in order for you to get credit. Financial calculators are not acceptable. After reviewing your pro formas for the new life sciences facility in the Inland Empire, the CFO of your company suggests that you change the rental calculations to better reflect the true value of the property after renovations. Use the midterm exam answer key to consider the following options: 1. Instead of the rent growth you previously assumed, you decide to calculate a step-up rent after year 1, with an increase of $10 in year 2 and $3 in each year thereafter. 2. Instead of step-up rent after year 2, you decide to calculate an indexed rent following the growth of the life sciences industry. You assume the industry will grow 10% in year 3 and annually every year thereafter. For each option, how does each NPV and IRR change? How does your analysis of the best option change for your company? Remember: Do all your calculations in Excel, and submit the final spreadsheet with all your work. Each cell must contain the correct formula in order for you to get credit. Financial calculators are not acceptable. Your CFO still isn't satisfied. She asks you to make one more adjustment: Don't let the tenant get away with a gross lease. Consider the following options: 1. Consider a double-net lease. How do NPV and IRR change? 2. Consider a triple-net lease. How do NPV and IRR change? Given all the options above, what is best for your company, and what is best for your partners
Step by Step Solution
There are 3 Steps involved in it

Get step-by-step solutions from verified subject matter experts