

Question: Using the above table of samples the preliminary U C L R is calculated as . The preliminary L C L R is calculated as
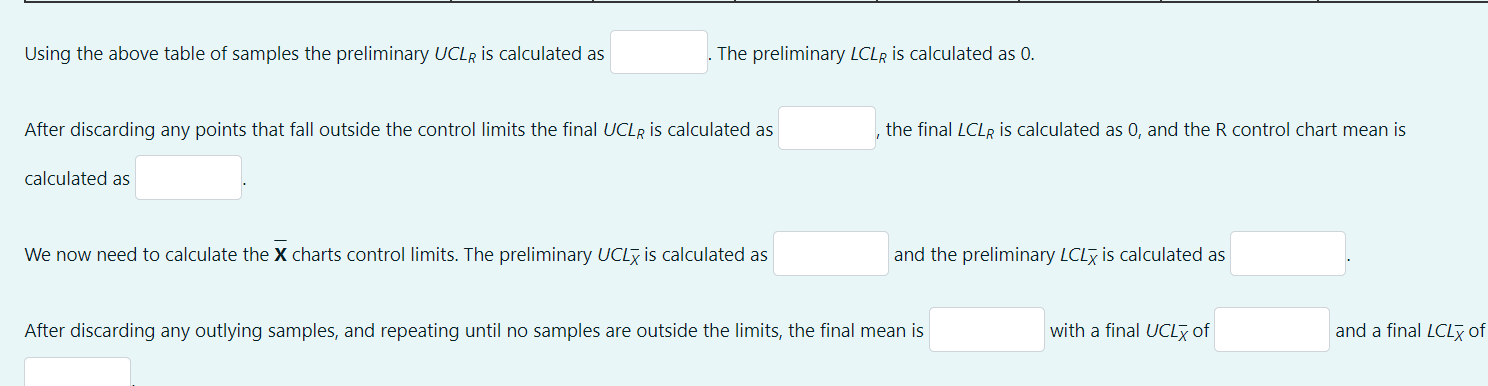
Using the above table of samples the preliminary is calculated as
The preliminary is calculated as
After discarding any points that fall outside the control limits the final is calculated as
the final is calculated as and the control chart mean is
calculated as
We now need to calculate the charts control limits The preliminary is calculated as
and the preliminary is calculated as
After discarding any outlying samples, and repeating until no samples are outside the limits the final mean is
with a final of
and a final of
Step by Step Solution
There are 3 Steps involved in it
1 Expert Approved Answer
Step: 1 Unlock

Question Has Been Solved by an Expert!
Get step-by-step solutions from verified subject matter experts
Step: 2 Unlock
Step: 3 Unlock