

Question: Using the accompanying Student Grades data, construct a scatter chart for midterm versus final exam grades and add a linear trendline. What is the model?
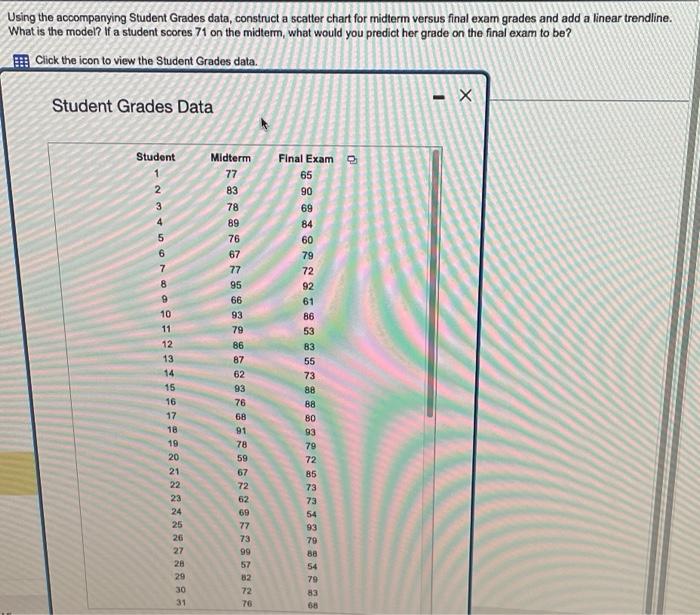
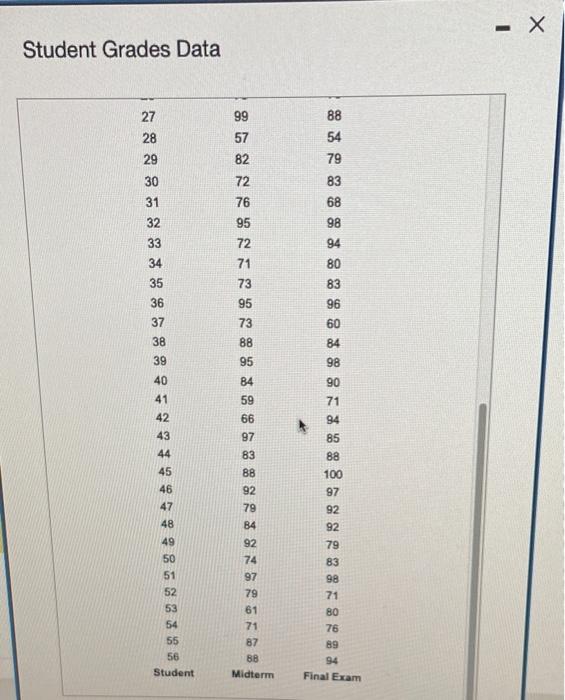
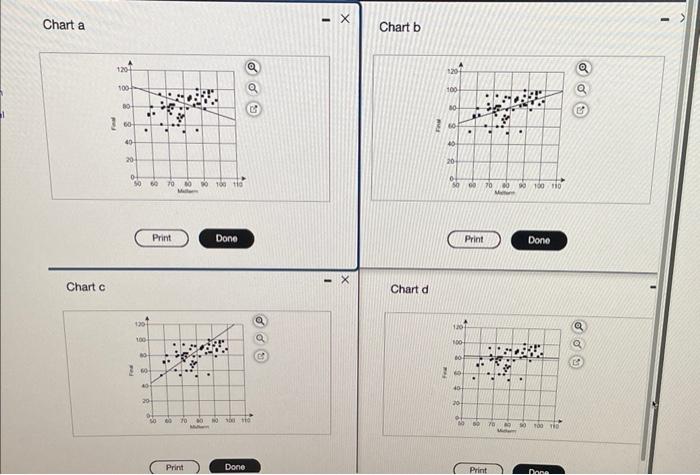
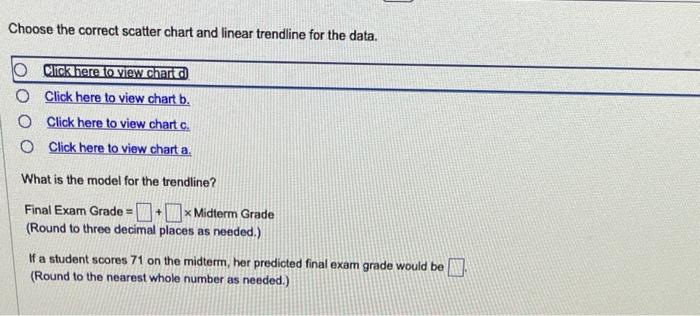
Using the accompanying Student Grades data, construct a scatter chart for midterm versus final exam grades and add a linear trendline. What is the model? If a student scores 71 on the midterm, what would you predict her grade on the final exam to be? Fi: Click the icon to view the Student Grades data. Student Grades Data Student Grades Data Chart a Choose the correct scatter chart and linear trendline for the data. Click here to view chartd Click here to view chart b. Click here to view chart c. Click here to view chart a. What is the model for the trendline? Final Exam Grade = + + Midterm Grade (Round to three decimal places as needed.) If a student scores 71 on the midterm, her predicted final exam grade would be (Round to the nearest whole number as needed.)
Step by Step Solution
There are 3 Steps involved in it

Get step-by-step solutions from verified subject matter experts