

Question: Using the AD-AS model, demonstrate which curves shift and how the equilibrium price level and Real GDP are affected by each of the scenarios in
Using the AD-AS model, demonstrate which curves shift and how the equilibrium price level and Real GDP are affected by each of the scenarios in both the short-run and the long-run (You can select individual curves and then copy and paste them into the graph.) HINT: Make a separate graph for the short-run and long-run. Assume that the scenario describes a situation that is unanticipated. Explain your reasoning fully.
Question to be Answered: "Suppose the Federal Reserve pushes up interest rates far faster than expected during the next year. Show and explain the effect of the increase in the real interest rate, all other things held constant"
See graph below:
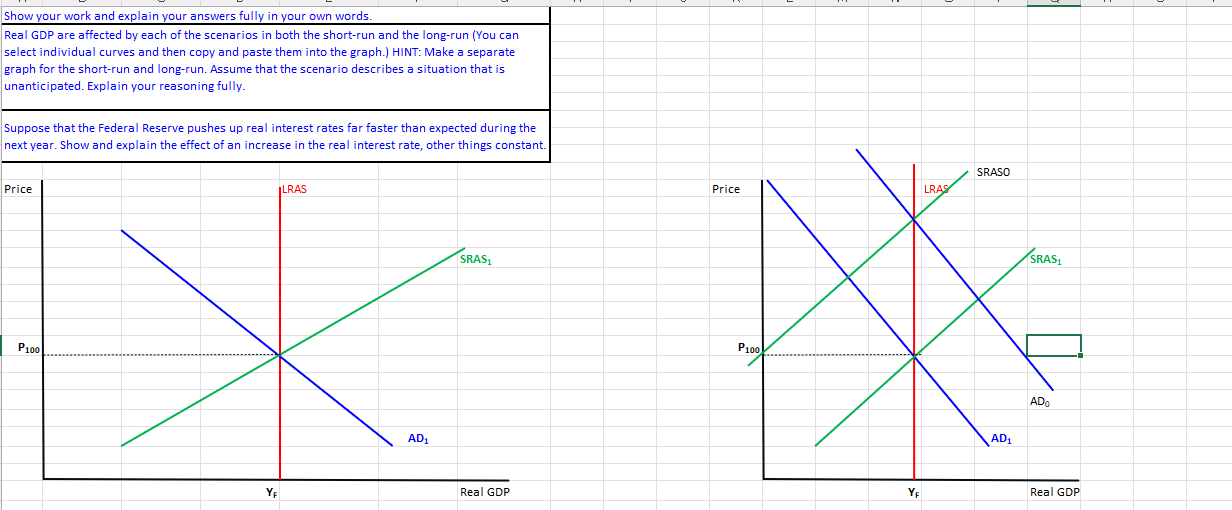
Show your work and explain your answers fully in your own words. Real GDP are affected by each of the scenarios in both the short-run and the long-run (You can select individual curves and then copy and paste them into the graph.) HINT: Make a separate graph for the short-run and long-run. Assume that the scenario describes a situation that is unanticipated. Explain your reasoning fully. Suppose that the Federal Reserve pushes up real interest rates far faster than expected during the next year. Show and explain the effect of an increase in the real interest rate, other things constant. SRASO Price LRAS SRAS1 SRAS1 P100 ADo AD AD1 YF Real GDP YE Real GDP
Step by Step Solution
There are 3 Steps involved in it

Get step-by-step solutions from verified subject matter experts