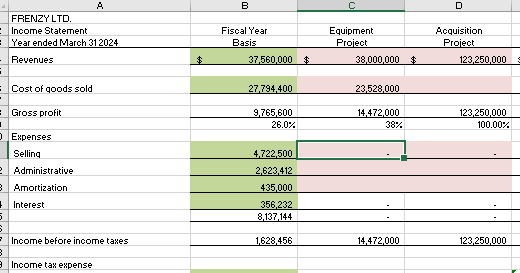
Question: Using the appropriate column on Financing Income Statement spreadsheet add relevant accounting figures from the Project Equipment and Project Acquisition Tabs from Phase 2A. As
Using the appropriate column on Financing Income Statement spreadsheet add relevant accounting figures from the
Project Equipment and Project Acquisition Tabs from Phase 2A. As an example the capital equipment tab indicates
that additional operating savings have been generated - reduce administrative expenses.
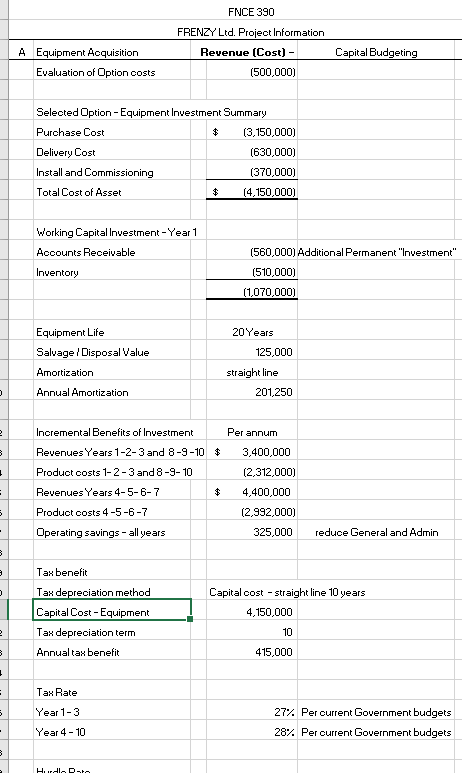
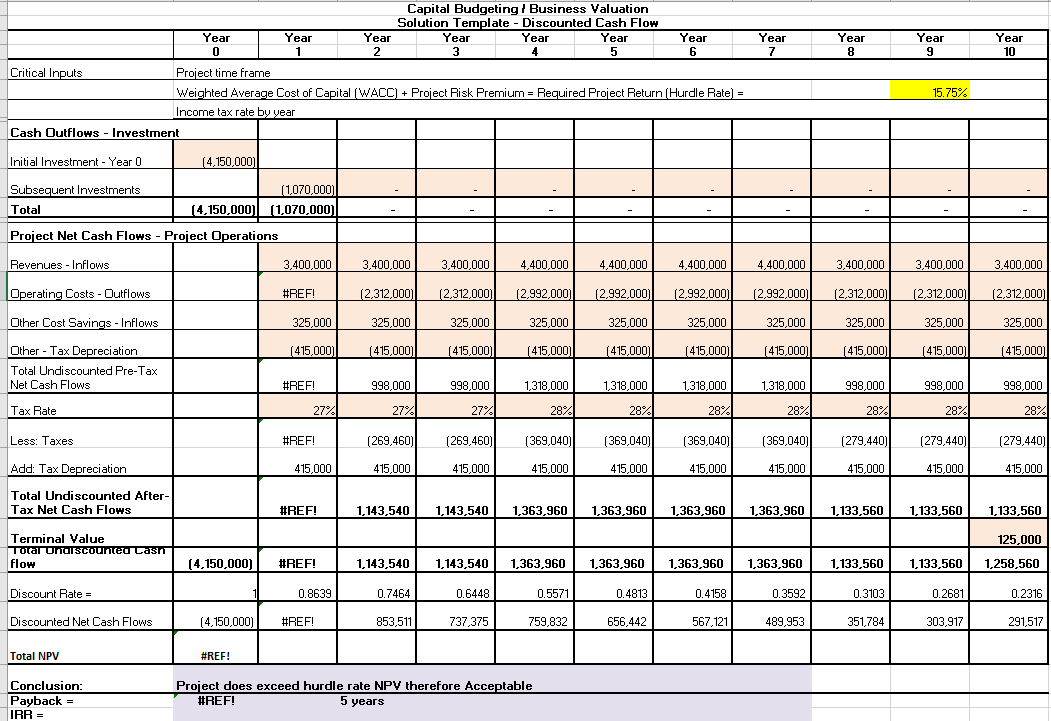
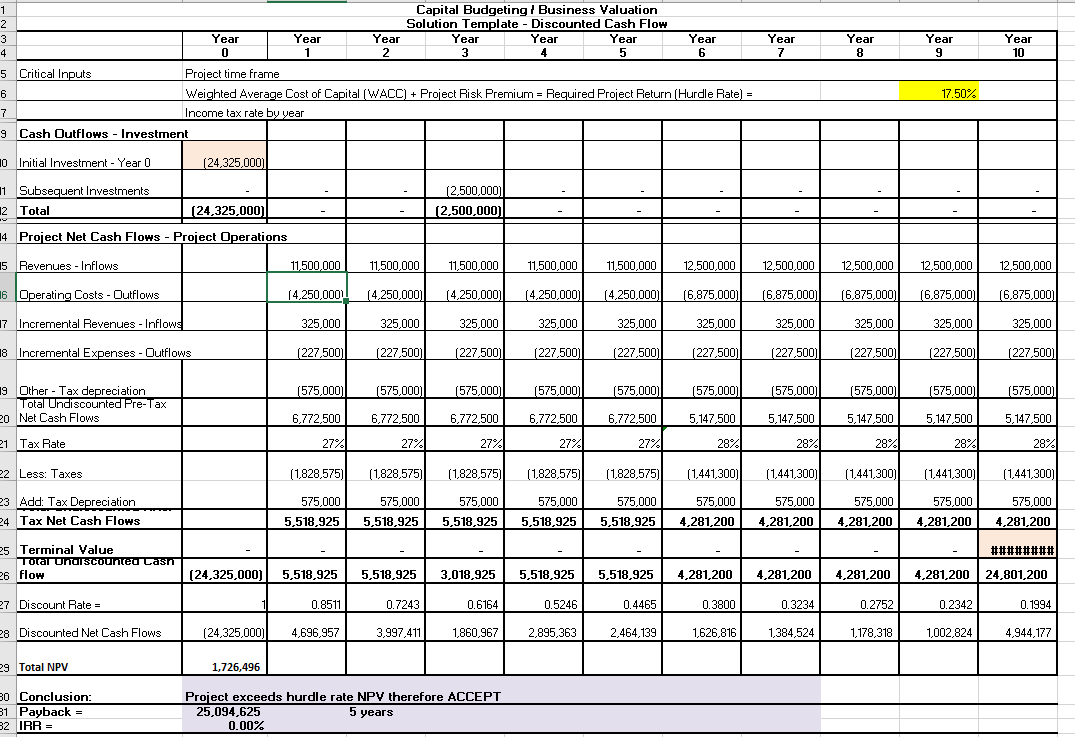
8 C FRENZY LTD. Income Statement Fiscal Year Equipment Acquisition Year ended March 312024 Basis Project Project Revenues 37,560,000 38,000,000 123,250,000 Cost of goods sold 27,794,400 23,528,000 Gross profit 9,765,600 14,472,000 123,250,000 26.0% 38% 100.00% Expenses Selling 4,722,500 Administrative 2,623,412 Amortization 435,000 Interest 356,232 8,137,144 Income before income taxes 1628,456 14,472,000 123,250,000 Income tax expenseFNCE 390 FRENZY Lid. Project Information A Equipment Acquisition Revenue (Cost] - Capital Budgeting Evaluation of Option costs (500,000) Selected Option - Equipment Investment Summary Purchase Cost $ (3.150,000) Delivery Cost (630,000) Install and Commissioning (370,000) Total Cost of Asset $ (4.150,000) Working Capital Investment - Year 1 Accounts Receivable (560,000) Additional Permanent "Investment" Inventory (510,000) (1,070,000) Equipment Life 20 Years Salvage / Disposal Value 125,000 Amortization straight line Annual Amortization 201,250 Incremental Benefits of Investment Per annum Revenues Years 1-2-3 and 8-9-10 $ 3,400,000 Product costs 1-2 -3 and 8-9-10 (2,312,000) Revenues Years 4- 5-6-7 $ 4.400,000 Product costs 4-5-6-7 (2,992,000) Operating savings - all years 325,000 reduce General and Admin Tax benefit Tax depreciation method Capital cost - straight line 10 years Capital Cost - Equipment 4,150,000 Tax depreciation term 10 Annual tax benefit 415.000 Tax Rate Year 1- 3 27% Per current Government budgets Year 4 - 10 28% Per current Government budgetsCapital Budgeting / Business Valuation Solution Template - Discounted Cash Flow Year Year Year Year Year Year Year Year Year Year Year 2 3 4 5 6 8 9 10 Critical Inputs Project time frame Cash Outflows - Investment Initial Investment - Year 0 Subsequent Investments Total Project Net Cash Flows - Project Operations Revenues - Inflows 3,400,000 Operating Costs - Outflows #REF! (2,312,000) [2.312,000 Other Cost Savings - Inflows 325.000 325,000 325,000 325.000 325.000 325.000 325,000 325,000 325,000 325,000 Other - Tax Depreciation (415,000) [415,000) 415,000) (415,000) 415,000) (415,000] (415,000) (415,000) 415,000) 415,000) Total Undiscounted Pre-Tax Net Cash Flows #REF 998.000 998.000 1,318,001 1,318,000 1.318,000 1,318,000 998.000 898.000 998.000 Tax Rate 27% 27% 27% 282 287 287 28%% Less: Taxes #REF! [269,460) [269.460) [369,040) (369,040) (369,040) (369,040) [279,440) (279.440) [279,440) Add: Tax Depreciation 415.000 415,000 415,000 415,000 415,000 415,000 415,000 415,000 415,000 415,000 Total Undiscounted After- Tax Net Cash Flows #REF! 1,143,540 1,143,540 1,363,960 1,363,960 1.363,960 1,363,960 1,133,560 1,133,560 1,133.560 Terminal Value 125,000 Total Ondiscounted Lash Flow (4.150,000) #REF! 1,143.540 1,143.540 1.363,960 1,363,960 1.363,960 1.363.960 1,133,560 1,133,560 1.258,560 Discount Rate = 0.8639 0.7464 0.6448 0.5571 0.4813 0.4158 1.3592 0.3103 0.2681 0.2316 Discounted Net Cash Flows (4,150,000) #REF! 853,511 737.375 759.832 656.442 567.121 489.953 351,784 303,917 291,517 Total NPV #REF! Conclusion: Project does exceed hurdle rate NPV therefore Acceptable Payback = #REF! 5 years IRR =Capital Budgeting / Business Valuation Solution Template - Discounted Cash Flow Year rear Year Year Year Year Year Year Year Year Year 2 3 4 5 6 7 8 9 10 Critical Inputs Project time frame Cash Outflows - Investment Initial Investment - Year 0 Subsequent Investments Total Project Net Cash Flows - Project Operations 15 Revenues - Inflows 12.500,000 Operating Costs - Outflows 14.250,0001 [4,250,000) [6.875,000) Incremental Revenues - Inflows 325.000 325.000 325.000 325.000 325,000 325,000 325,000 325.000 325,000 325.000 Incremental Expenses - Outflows (227.500 [227.500) [227.500) (227,500) [227.500) (227.500) (227 500) (227.500 (227.500) (227.500) Other - Tax depreciation (575.000) (575,000) (575,000) [575,000) 1575,000 (575,000) 575,000 (575,000) (575,000) [575,000) Total Undiscounted Pre-Tax 20 Net Cash Flows 6,772.500 6.772.500 6.772,500 6.772,500 6.772,500 5.147.500 5.147.500 5.147.500 5.147.500 5.147.500 Tax Rate 27% 27% 27% 27% 28% 28% 28% 28% Less: Taxes [1,828.575) [1,828.575) [1.828.575) [1,828.575) [1,828.575) [1,441,300) [1,441,300) [1,441,300) [1.441,300) [1,441,300) 23 Add: Tax Depreciation 575,000 575,000 575,000 575,000 575,000 575,000 575,000 575,000 575,000 575,000 24 Tax Net Cash Flows 5,518,925 5,518,925 5,518,925 5,518,925 5,518,925 4.281,200 4.281,200 4.281,200 4.281,200 4.281.200 25 Terminal Value Total Undiscounted Lash Flow (24.325,000] 5,518,925 5.518,925 3.018,925 5,518,925 5,518,925 4.281,200 4.281,200 4.281,200 4.281,200 24,801,200 27 Discount Rate = 0.8511 0.7243 0.6164 0.5246 0.4465 0.3800 0.3234 0.2752 0.2342 0. 1994 28 Discounted Net Cash Flows (24,325,000) 4,696.957 3,997 411 1.860.967 2.895,363 2.464,135 1,626,816 1,384.524 1,178,318 1,002 824 4,944.177 Total NPV 1,726,496 30 Conclusion: Project exceeds hurdle rate NPV therefore ACCEPT Payback = 25,094.625 5 years 2 IRA = 0.00%
Step by Step Solution
There are 3 Steps involved in it
1 Expert Approved Answer
Step: 1 Unlock
Question Has Been Solved by an Expert!
Get step-by-step solutions from verified subject matter experts
Step: 2 Unlock
Step: 3 Unlock
Students Have Also Explored These Related Finance Questions!