Question: Using the appropriate model, sample size n, and output below: Model: y. Po + ,*+ 8x2 + 3x3 + Sample size: n= 16 Regression Statistics
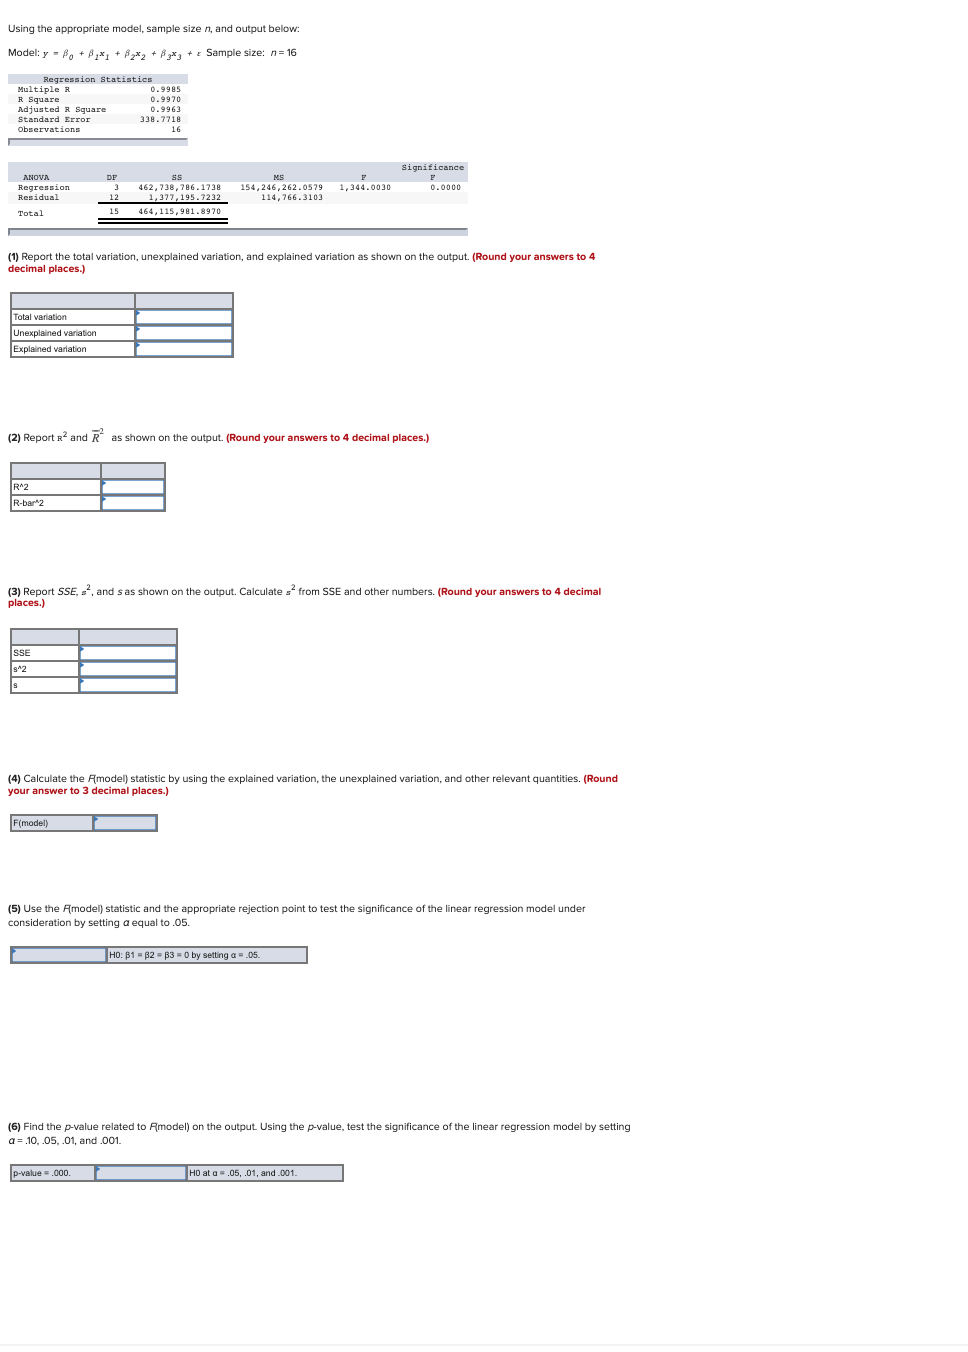
Using the appropriate model, sample size n, and output below: Model: y. Po + ,*+ 8x2 + 3x3 + Sample size: n= 16 Regression Statistics Multiplex 0.9985 R Square 0.9970 Adjusted R Square 0.9963 Standard Error 338.7218 he Observations 16 DF ANOVA Regression Residual Significance F 0.0000 MS 154,246, 262.0579 114,766.3103 1,344.0030 SS 462,738,786.1738 1,377, 195.7232 464, 115, 981.8970 12 Total 15 (1) Report the total variation, unexplained variation, and explained variation as shown on the output. (Round your answers to 4 decimal places.) Total variation Unexplained variation Explained variation (2) Report R2 and R as shown on the output. (Round your answers to 4 decimal places.) R^2 R-bar2 (3) Report SSE, -2, and s as shown on the output. Calculate 2 from SSE and other numbers. (Round your answers to 4 decimal places.) SSE S42 S (4) Calculate the model) statistic by using the explained variation, the unexplained variation, and other relevant quantities. (Round your answer to 3 decimal places.) F(model) (5) Use the Almodel) statistic and the appropriate rejection point to test the significance of the linear regression model under consideration by setting a equal to .05. HO: B1 = 32 - 33 = by setting a = .05. (6) Find the p-value related to Amodel) on the output. Using the p-value, test the significance of the linear regression model by setting a=.10, .05, 01, and .001. p-value = .000 HO at a = .05,.01, and .001. a Using the appropriate model, sample size n, and output below: Model: y. Po + ,*+ 8x2 + 3x3 + Sample size: n= 16 Regression Statistics Multiplex 0.9985 R Square 0.9970 Adjusted R Square 0.9963 Standard Error 338.7218 he Observations 16 DF ANOVA Regression Residual Significance F 0.0000 MS 154,246, 262.0579 114,766.3103 1,344.0030 SS 462,738,786.1738 1,377, 195.7232 464, 115, 981.8970 12 Total 15 (1) Report the total variation, unexplained variation, and explained variation as shown on the output. (Round your answers to 4 decimal places.) Total variation Unexplained variation Explained variation (2) Report R2 and R as shown on the output. (Round your answers to 4 decimal places.) R^2 R-bar2 (3) Report SSE, -2, and s as shown on the output. Calculate 2 from SSE and other numbers. (Round your answers to 4 decimal places.) SSE S42 S (4) Calculate the model) statistic by using the explained variation, the unexplained variation, and other relevant quantities. (Round your answer to 3 decimal places.) F(model) (5) Use the Almodel) statistic and the appropriate rejection point to test the significance of the linear regression model under consideration by setting a equal to .05. HO: B1 = 32 - 33 = by setting a = .05. (6) Find the p-value related to Amodel) on the output. Using the p-value, test the significance of the linear regression model by setting a=.10, .05, 01, and .001. p-value = .000 HO at a = .05,.01, and .001. a


