Question: Using the assumptions provided in the case, estimate the intrinsic value of Wal-Mart stock using the single stage (i.e. constant growth) model Based on the
- Using the assumptions provided in the case, estimate the intrinsic value of Wal-Mart stock using the single stage (i.e. constant growth) model
- Based on the computed value in 2 above, what is your recommendation buy or sell?
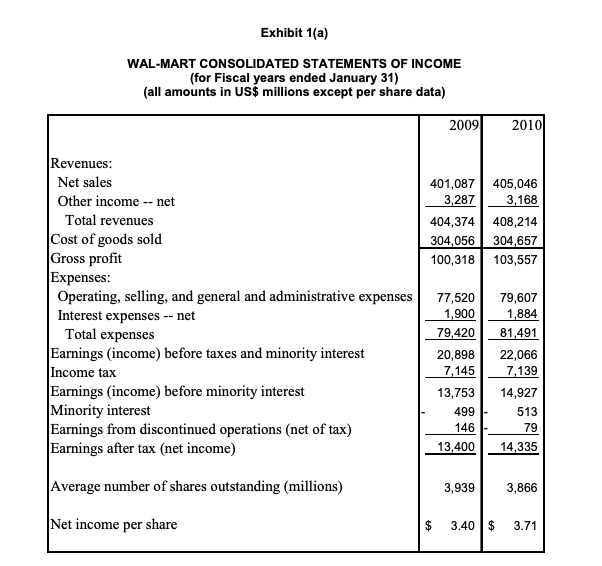
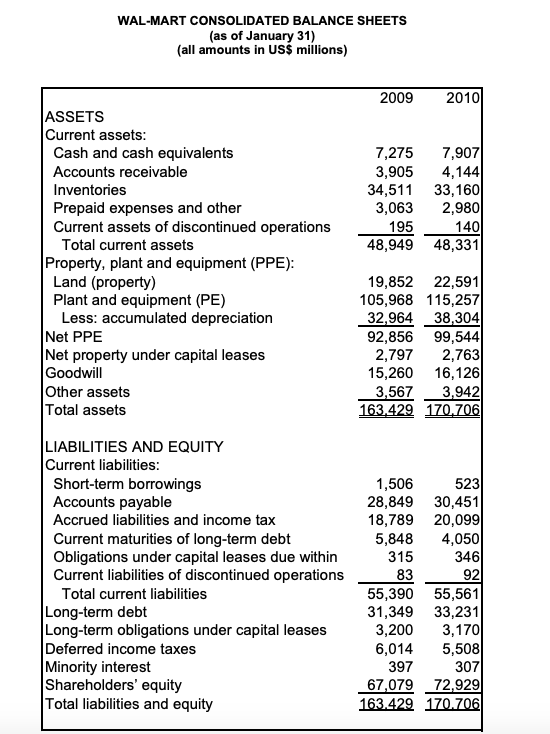
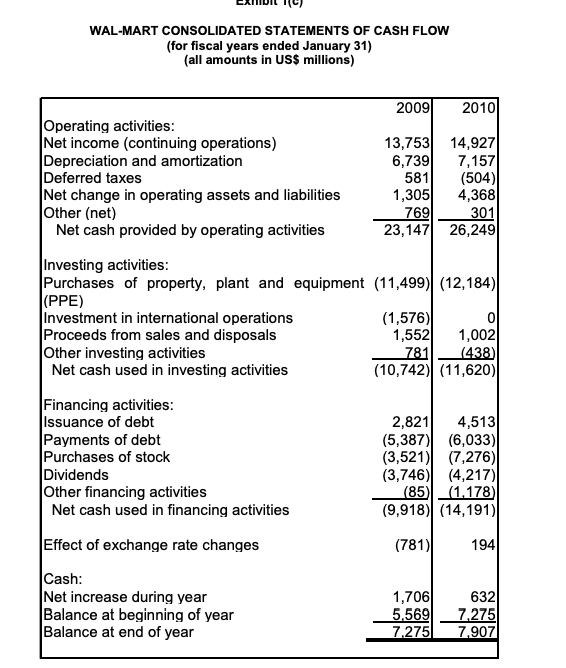
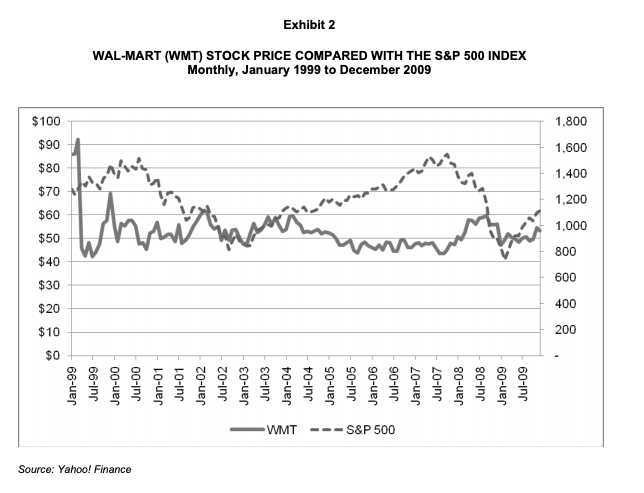
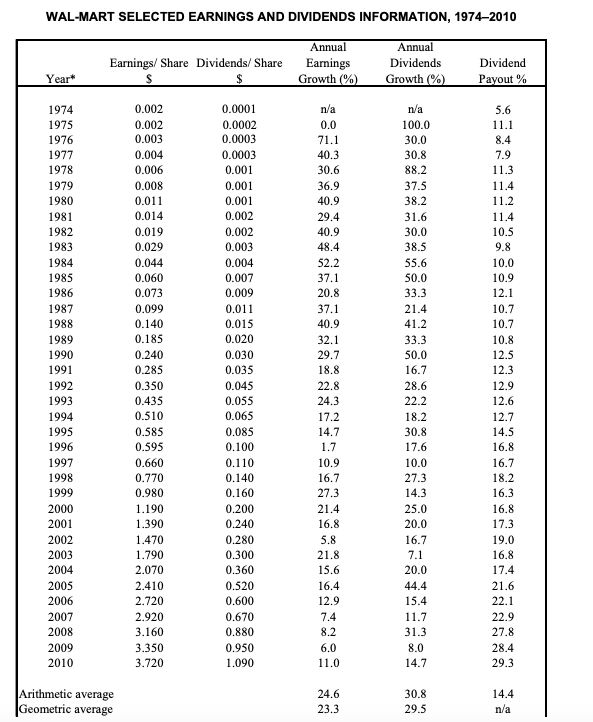
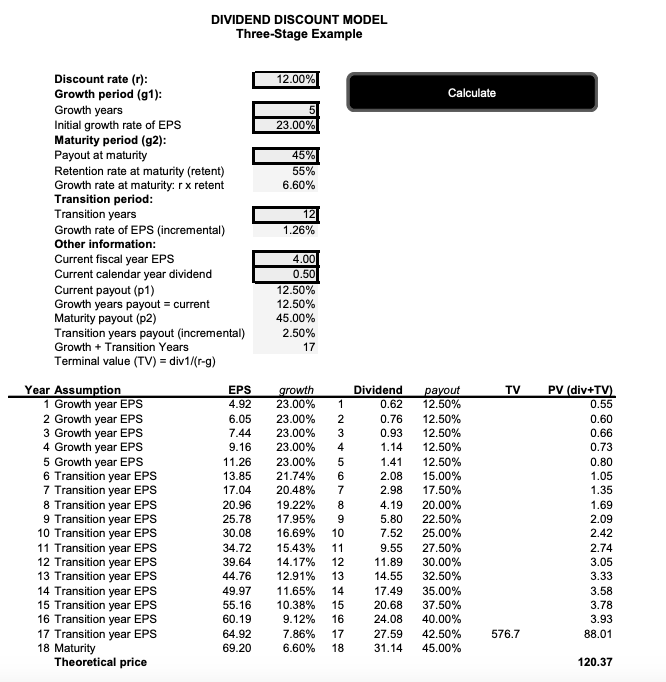
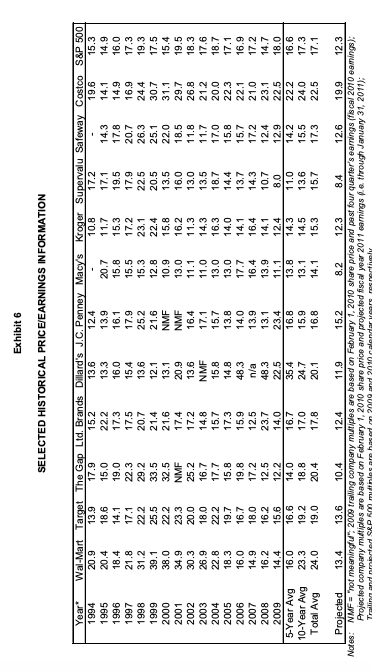
Exhibit 1(a) WAL-MART CONSOLIDATED STATEMENTS OF INCOME (for Fiscal years ended January 31) (all amounts in US$ millions except per share data) 2010 2009 Revenues 401,087 405,046 Net sales Other income 3,287 3,168 net - Total revenues 404,374 408,214 Cost of goods sold Gross profit Expenses: Operating, selling, and general and administrative expenses Interest expenses Total expenses 304.056 304,657 100,318 103,557 77,520 79,607 1,900 1,884 net - 79,420 81,491 Earnings (income) before taxes and minority interest Income tax Earnings (income) before minority interest Minority interest Earnings from discontinued operations (net of tax) Earnings after tax (net income) 20,898 22,066 7,145 7,139 13,753 14,927 499 513 146 79 14,335 13,400 Average number of shares outstanding (millions) 3,939 3,866 Net income per share 3.40 $ 3.71 WAL-MART CONSOLIDATED BALANCE SHEETS (as of January 31) (all amounts in US$ millions) 2009 2010 ASSETS Current assets: Cash and cash equivalents 7,907 4,144 33,160 2,980 7,275 3,905 34,511 3,063 Accounts receivable Inventories Prepaid expenses and other Current assets of discontinued operations Total current assets Property, plant and equipment (PPE) Land (property) Plant and equipment (PE) Less: accumulated depreciation Net PPE Net property under capital leases Goodwill Other assets Total assets 195 140 48,949 48,331 22,591 105,968 115,257 38,304 19,852 32,964 92,856 99,544 2,797 2,763 16,126 15,260 3,942 3,567 163.429 170.706 LIABILITIES AND EQUITY Current liabilities Short-term borrowings Accounts payable 523 30,451 20,099 4,050 346 92 1,506 28,849 18,789 5,848 Accrued liabilities and income tax Current maturities of long-term debt Obligations under capital leases due within Current liabilities of discontinued operations 315 83 55,390 55,561 31,349 33,231 3,170 3,200 Total current liabilities Long-term debt Long-term obligations under capital leases Deferred income taxes Minority interest Shareholders' equity Total liabilities and equity 5,508 6,014 397 307 67,079 72,929 163.429 170706 WAL-MART CONSOLIDATED STATEMENTS OF CASH FLOW (for fiscal years ended January 31) (all amounts in US$ millions) 2009 2010 Operating activities: Net income (continuing operations) Depreciation and amortization Deferred taxes Net change in operating assets and liabilities Other (net) Net cash provided by operating activities 14,927 7,157 (504) 4,368 301 26,249 13,753 6,739 581 1,305 769 23,147 Investing activities: Purchases of property, plant and equipment (11,499) (12,184) (PPE) Investment in international operations Proceeds from sales and disposals Other investing activities Net cash used in investing activities (1,576) 1,552 1,002 (438) 781 (10,742) (11,620) Financing activities: Issuance of debt Payments of debt Purchases of stock Dividends Other financing activities Net cash used in financing activities 2,821 4,513 (5,387)(6,033) (3,521) (7,276) (3,746)(4,217) (85(1.178) (9,918) (14,191) Effect of exchange rate changes 194 (781 Cash: Net increase during year Balance at beginning of year Balance at end of year 1,706 5,569 7,275 632 7,275 7,907 Exhibit 2 WAL-MART (WMT) STOCK PRICE COMPARED WITH THE S&P 500 INDEX Monthly, January 1999 to December 2009 $100 1,800 $90 1,600 $80 1,400 $70 1,200 $60 1,000 $50 W $40 w 800 600 $30 400 $20 200 $10 $0 WMT S&P 500 Source: Yahoo! Finance 66-uer 66-Inr 00-uer 00-inr Jan-01 Jul-01 Jan-02 Jul-02 Jan-03 Jul-03 Jan-04 Jul-04 Jan-05 Jul-05 Jan-06 90-Inr Jan-07 Jul-07 Jan-08 Jul-08 Jan-09 60-inr WAL-MART SELECTED EARNINGS AND DIVIDENDS INFORMATION, 1974-2010 Annual Annual Earnings/ Share Dividends/ Share Eamings Growth (%) Dividends Dividend Year Growth (%) Payout% 0,002 0.0001 n/a n/a 1974 5.6 1975 0.002 0.0002 0.0 100.0 11.1 0.003 0.0003 1976 71.1 30.0 8.4 0,004 1977 0.0003 40.3 30.8 7.9 1978 0.006 0.001 30.6 88.2 11.3 1979 0,008 0.001 36.9 37.5 11.4 1980 0.011 0.001 40.9 38.2 11.2 0,014 0.002 1981 29.4 31.6 11.4 1982 0.019 0.002 0.9 30.0 10.5 1983 0.029 0,003 48.4 38.5 9,8 52.2 1984 0,044 0.004 55.6 10.0 1985 0.060 0.007 37.1 50,0 10.9 1986 0.073 0.009 20.8 33.3 12.1 1987 0.099 0.011 37.1 21.4 10.7 1988 0.140 0.015 40,9 41.2 10.7 0.185 0.020 1989 32.1 33.3 10.8 1990 0.240 0.030 29.7 50.0 12.5 1991 0.285 0.035 18,8 16.7 12.3 1992 0.350 0.045 22,8 28.6 12.9 1993 0.435 0.055 24.3 22.2 12.6 0.510 0.065 1994 17.2 18.2 12.7 1995 0.585 0.085 14.7 30.8 14.5 1996 0.595 0.100 1.7 17.6 16.8 1997 0.660 0.110 10.9 10.0 16.7 1998 0.770 0.140 16.7 27.3 18.2 1999 0.980 0.160 27.3 14.3 16.3 2000 1.190 0.200 21.4 25.0 16.8 2001 1.390 0.240 16,8 20.0 17.3 2002 1.470 0.280 5.8 16,7 19.0 2003 1.790 0.300 21.8 7.1 16.8 2004 2.070 0.360 15.6 20.0 17.4 2005 2,410 0.520 16.4 44.4 21.6 2006 2.720 0.600 12.9 15.4 22.1 2007 2,920 0.670 7.4 11.7 22.9 2008 3.160 0.880 8.2 31.3 27.8 2009 3.350 0.950 6,0 8.0 28.4 2010 3.720 1.090 11.0 14.7 29.3 Arithmetic average Geometric average 24.6 30.8 14.4 23.3 29.5 n/a DIVIDEND DISCOUNT MODEL Three-Stage Example Discount rate (r) Growth period (g1) Growth years Initial growth rate of EPS Maturity period (g2): Payout at maturity Retention rate at maturity (retent) Growth rate at maturity Transition period: Transition years Growth rate of EPS (incremental) 12.00% Calculate 5 23.00% 45% 55% 6.60% rx retent 12 1.26% Other information: 4.00 0.50 12.50% 12,50% Current fiscal year EPS Current calendar year dividend Current payout (p1) Growth years payout = current Maturity payout (p2) Transition years payout (incremental) Growth Transition Years 45,00% 2.50% 17 Terminal value (TV) div1/(r-g) Year Assumption 1 Growth year EPS 2 Growth year EPS 3 Growth year EPS 4 Growth year EPS 5 Growth year EPS 6 Transition year EPS 7 Transition year EPS 8 Transition year EPS 9 Transition year EPS PV (div+TV) EPS Dividend growth 23.00% TV payout 4.92 1 0.62 12.50% 0.55 6.05 23.00% 0.76 12,50% 0.60 2 23.00% 3 0.93 12.50% 0.66 7,44 12.50% 12,50% 9.16 23.00% 1.14 4 0.73 11.26 23.00% 5 1,41 0.80 13.85 21.74% 6 2.08 15.00% 1.05 17.04 20.48% 7 2,98 17.50% 1.35 20.96 19.22% 8 20.00% 1.69 4.19 22.50% 17.95% 25.78 5,80 2,09 10 Transition year EPS 11 Transition year EPS 12 Transition year EPS 13 Transition year EPS 14 Transition year EPS 15 Transition year EPS 16 Transition year EPS 17 Transition year EPS 18 Maturity Theoretical price 30.08 16.69% 10 7,52 25.00% 2,42 34.72 15.43% 11 9,55 27,50% 2.74 39.64 14.17% 12 11.89 30.00% 32.50% 3,05 44.76 12.91% 13 3.33 14.55 11.65% 49,97 35.00% 37,50% 3.58 14 17.49 55.16 10.38% 20.68 15 3.78 60.19 16 24.08 40.00% 3.93 9.12% 64.92 7.86% 17 576.7 88.01 27.59 42.50% 69.20 6.60% 18 31.14 45.00% 120,37 Exhibit 5 WAL-MART BETA ESTIMATE for explanation. EquityBETA Relative Index SPX Index 02/01/08 WMT US Equity Historical Beta Weekly Local CCY .ast Price OBeta +/- -01/29/10 Period Data Range Non-Parametric Linear Y = WAL-MART STORES INC X= S&P 500 INDEX Value Item Raw BETA 0.483 Adj BETA ALLPHA(Intercept) R^2(Correlation 2) Std Dev Of Error Std Error Of ALPHA 0.655 0.181 0.338 2.812 0.276 Std Error Of BETA 0,067 Number Of Points 104 -10- -15- Last Observation -20 10 15 -15 10 X-SL Ddeo Australia 61 2 9777 8600 Brazil 5511 3048 4500 Europe 44 20 7330 7500 Gernany 49 69 9204 1210 Hong Kong 852 2977 6000 Copuright 2010 Bloowberg Finance L P. SN 242636 H276-1002-0 05-Jul-2010 13:46 42 Japan 81 3 3201 8900 Singopore 65 6212 1000 U.S 1 212 318 2000 Source: Bloomberg mu-A sbuwea-owd 3/d anpadsa S0puao OLOZ pu 600z uo paseq ave soydiu 009 dS popaod pua Bu :(L0z LE Aenuer yEnoua 9 sbuuesL02 Je9eosy paead pue oud aeys oLOz enuge uo paseq ae sedp Aueduoo paoaaud (sbuwee O10Z 180s) sBuuee sjeuenb unoy ised pue eoud eusus oL0z enugey uo peseq ave sepdyanuu Ausduoo Bue % 00' L % 00'9 %00'02 %0L'02 % 02'9 e/u % 6E0L %09E % 08'S e/u e/u 6E paN-eM %L9'96 %09,9 e/u %00 S %8L'6 %98'9 09'EL 09 9 Bu 0'1 e/u Industry e/u inb3 Ainb3 e/u Equity Ainb3 e/u 99 %E8 0L %09't- 00 8 009 d8S Margin Margin Projected uouuo uouo od uo uunia wl-BuoT pajoofod SLOZ Trailing Projected Earnings Earnings Projected OLOZ Projected S1sed uo SeaA -6uon Projected OLOZ opey03d (Trailing 2015 (L0 E Aenuer uno sBuues Lo ea posy pajoefod pue aoud ays o102 ARnge uo poseq a sodip unduoo pajoafo (sbuwee O10Z 180s) sBuuee seuenb noy ised pue eoud eus o10z nugey un peseq ae sepdyanu Aueduroo Buye 6002npnou o, WN papeloud 6 6L 9L 8 6LL 9'EL 0'6 9LL 0'LL 02 8'8L 0 L 0'2 89 6'SL 6y JeeA-O 6A JEBA-S 9'EL SL z'6L 9'9L 2 89 9'9L 0 9 OL 9SL 29 6002 8002 O'8L 62L 0'8 6'EL z9k 08L 6 9 L'L 6EL O'L L002 9002 e/u 6'9 LLL 6'SL 8'6L 0'9h 85 O 9002 LLL L9L 9'22 002 8002 002 0'SL 9LL S'EL 0 LL 8L 6'92 892 8LL 9 0'02 Z002 WN 6 L002 0002 g'6L 09 29 WN 6'02 85 6'0L 9 12 666 866L L66L SLL 8 21 912 S'6L S'92 9E L02 6LL 62L 8'2 69 6L 966 S66 66 0'9 9LL 09 0'6L 02 6 02 6' LLL L'02 6SL 98 g6 soo Aewajes neodns Joboy 009 dS 9 1q14x3 Exhibit 1(a) WAL-MART CONSOLIDATED STATEMENTS OF INCOME (for Fiscal years ended January 31) (all amounts in US$ millions except per share data) 2010 2009 Revenues 401,087 405,046 Net sales Other income 3,287 3,168 net - Total revenues 404,374 408,214 Cost of goods sold Gross profit Expenses: Operating, selling, and general and administrative expenses Interest expenses Total expenses 304.056 304,657 100,318 103,557 77,520 79,607 1,900 1,884 net - 79,420 81,491 Earnings (income) before taxes and minority interest Income tax Earnings (income) before minority interest Minority interest Earnings from discontinued operations (net of tax) Earnings after tax (net income) 20,898 22,066 7,145 7,139 13,753 14,927 499 513 146 79 14,335 13,400 Average number of shares outstanding (millions) 3,939 3,866 Net income per share 3.40 $ 3.71 WAL-MART CONSOLIDATED BALANCE SHEETS (as of January 31) (all amounts in US$ millions) 2009 2010 ASSETS Current assets: Cash and cash equivalents 7,907 4,144 33,160 2,980 7,275 3,905 34,511 3,063 Accounts receivable Inventories Prepaid expenses and other Current assets of discontinued operations Total current assets Property, plant and equipment (PPE) Land (property) Plant and equipment (PE) Less: accumulated depreciation Net PPE Net property under capital leases Goodwill Other assets Total assets 195 140 48,949 48,331 22,591 105,968 115,257 38,304 19,852 32,964 92,856 99,544 2,797 2,763 16,126 15,260 3,942 3,567 163.429 170.706 LIABILITIES AND EQUITY Current liabilities Short-term borrowings Accounts payable 523 30,451 20,099 4,050 346 92 1,506 28,849 18,789 5,848 Accrued liabilities and income tax Current maturities of long-term debt Obligations under capital leases due within Current liabilities of discontinued operations 315 83 55,390 55,561 31,349 33,231 3,170 3,200 Total current liabilities Long-term debt Long-term obligations under capital leases Deferred income taxes Minority interest Shareholders' equity Total liabilities and equity 5,508 6,014 397 307 67,079 72,929 163.429 170706 WAL-MART CONSOLIDATED STATEMENTS OF CASH FLOW (for fiscal years ended January 31) (all amounts in US$ millions) 2009 2010 Operating activities: Net income (continuing operations) Depreciation and amortization Deferred taxes Net change in operating assets and liabilities Other (net) Net cash provided by operating activities 14,927 7,157 (504) 4,368 301 26,249 13,753 6,739 581 1,305 769 23,147 Investing activities: Purchases of property, plant and equipment (11,499) (12,184) (PPE) Investment in international operations Proceeds from sales and disposals Other investing activities Net cash used in investing activities (1,576) 1,552 1,002 (438) 781 (10,742) (11,620) Financing activities: Issuance of debt Payments of debt Purchases of stock Dividends Other financing activities Net cash used in financing activities 2,821 4,513 (5,387)(6,033) (3,521) (7,276) (3,746)(4,217) (85(1.178) (9,918) (14,191) Effect of exchange rate changes 194 (781 Cash: Net increase during year Balance at beginning of year Balance at end of year 1,706 5,569 7,275 632 7,275 7,907 Exhibit 2 WAL-MART (WMT) STOCK PRICE COMPARED WITH THE S&P 500 INDEX Monthly, January 1999 to December 2009 $100 1,800 $90 1,600 $80 1,400 $70 1,200 $60 1,000 $50 W $40 w 800 600 $30 400 $20 200 $10 $0 WMT S&P 500 Source: Yahoo! Finance 66-uer 66-Inr 00-uer 00-inr Jan-01 Jul-01 Jan-02 Jul-02 Jan-03 Jul-03 Jan-04 Jul-04 Jan-05 Jul-05 Jan-06 90-Inr Jan-07 Jul-07 Jan-08 Jul-08 Jan-09 60-inr WAL-MART SELECTED EARNINGS AND DIVIDENDS INFORMATION, 1974-2010 Annual Annual Earnings/ Share Dividends/ Share Eamings Growth (%) Dividends Dividend Year Growth (%) Payout% 0,002 0.0001 n/a n/a 1974 5.6 1975 0.002 0.0002 0.0 100.0 11.1 0.003 0.0003 1976 71.1 30.0 8.4 0,004 1977 0.0003 40.3 30.8 7.9 1978 0.006 0.001 30.6 88.2 11.3 1979 0,008 0.001 36.9 37.5 11.4 1980 0.011 0.001 40.9 38.2 11.2 0,014 0.002 1981 29.4 31.6 11.4 1982 0.019 0.002 0.9 30.0 10.5 1983 0.029 0,003 48.4 38.5 9,8 52.2 1984 0,044 0.004 55.6 10.0 1985 0.060 0.007 37.1 50,0 10.9 1986 0.073 0.009 20.8 33.3 12.1 1987 0.099 0.011 37.1 21.4 10.7 1988 0.140 0.015 40,9 41.2 10.7 0.185 0.020 1989 32.1 33.3 10.8 1990 0.240 0.030 29.7 50.0 12.5 1991 0.285 0.035 18,8 16.7 12.3 1992 0.350 0.045 22,8 28.6 12.9 1993 0.435 0.055 24.3 22.2 12.6 0.510 0.065 1994 17.2 18.2 12.7 1995 0.585 0.085 14.7 30.8 14.5 1996 0.595 0.100 1.7 17.6 16.8 1997 0.660 0.110 10.9 10.0 16.7 1998 0.770 0.140 16.7 27.3 18.2 1999 0.980 0.160 27.3 14.3 16.3 2000 1.190 0.200 21.4 25.0 16.8 2001 1.390 0.240 16,8 20.0 17.3 2002 1.470 0.280 5.8 16,7 19.0 2003 1.790 0.300 21.8 7.1 16.8 2004 2.070 0.360 15.6 20.0 17.4 2005 2,410 0.520 16.4 44.4 21.6 2006 2.720 0.600 12.9 15.4 22.1 2007 2,920 0.670 7.4 11.7 22.9 2008 3.160 0.880 8.2 31.3 27.8 2009 3.350 0.950 6,0 8.0 28.4 2010 3.720 1.090 11.0 14.7 29.3 Arithmetic average Geometric average 24.6 30.8 14.4 23.3 29.5 n/a DIVIDEND DISCOUNT MODEL Three-Stage Example Discount rate (r) Growth period (g1) Growth years Initial growth rate of EPS Maturity period (g2): Payout at maturity Retention rate at maturity (retent) Growth rate at maturity Transition period: Transition years Growth rate of EPS (incremental) 12.00% Calculate 5 23.00% 45% 55% 6.60% rx retent 12 1.26% Other information: 4.00 0.50 12.50% 12,50% Current fiscal year EPS Current calendar year dividend Current payout (p1) Growth years payout = current Maturity payout (p2) Transition years payout (incremental) Growth Transition Years 45,00% 2.50% 17 Terminal value (TV) div1/(r-g) Year Assumption 1 Growth year EPS 2 Growth year EPS 3 Growth year EPS 4 Growth year EPS 5 Growth year EPS 6 Transition year EPS 7 Transition year EPS 8 Transition year EPS 9 Transition year EPS PV (div+TV) EPS Dividend growth 23.00% TV payout 4.92 1 0.62 12.50% 0.55 6.05 23.00% 0.76 12,50% 0.60 2 23.00% 3 0.93 12.50% 0.66 7,44 12.50% 12,50% 9.16 23.00% 1.14 4 0.73 11.26 23.00% 5 1,41 0.80 13.85 21.74% 6 2.08 15.00% 1.05 17.04 20.48% 7 2,98 17.50% 1.35 20.96 19.22% 8 20.00% 1.69 4.19 22.50% 17.95% 25.78 5,80 2,09 10 Transition year EPS 11 Transition year EPS 12 Transition year EPS 13 Transition year EPS 14 Transition year EPS 15 Transition year EPS 16 Transition year EPS 17 Transition year EPS 18 Maturity Theoretical price 30.08 16.69% 10 7,52 25.00% 2,42 34.72 15.43% 11 9,55 27,50% 2.74 39.64 14.17% 12 11.89 30.00% 32.50% 3,05 44.76 12.91% 13 3.33 14.55 11.65% 49,97 35.00% 37,50% 3.58 14 17.49 55.16 10.38% 20.68 15 3.78 60.19 16 24.08 40.00% 3.93 9.12% 64.92 7.86% 17 576.7 88.01 27.59 42.50% 69.20 6.60% 18 31.14 45.00% 120,37 Exhibit 5 WAL-MART BETA ESTIMATE for explanation. EquityBETA Relative Index SPX Index 02/01/08 WMT US Equity Historical Beta Weekly Local CCY .ast Price OBeta +/- -01/29/10 Period Data Range Non-Parametric Linear Y = WAL-MART STORES INC X= S&P 500 INDEX Value Item Raw BETA 0.483 Adj BETA ALLPHA(Intercept) R^2(Correlation 2) Std Dev Of Error Std Error Of ALPHA 0.655 0.181 0.338 2.812 0.276 Std Error Of BETA 0,067 Number Of Points 104 -10- -15- Last Observation -20 10 15 -15 10 X-SL Ddeo Australia 61 2 9777 8600 Brazil 5511 3048 4500 Europe 44 20 7330 7500 Gernany 49 69 9204 1210 Hong Kong 852 2977 6000 Copuright 2010 Bloowberg Finance L P. SN 242636 H276-1002-0 05-Jul-2010 13:46 42 Japan 81 3 3201 8900 Singopore 65 6212 1000 U.S 1 212 318 2000 Source: Bloomberg mu-A sbuwea-owd 3/d anpadsa S0puao OLOZ pu 600z uo paseq ave soydiu 009 dS popaod pua Bu :(L0z LE Aenuer yEnoua 9 sbuuesL02 Je9eosy paead pue oud aeys oLOz enuge uo paseq ae sedp Aueduoo paoaaud (sbuwee O10Z 180s) sBuuee sjeuenb unoy ised pue eoud eusus oL0z enugey uo peseq ave sepdyanuu Ausduoo Bue % 00' L % 00'9 %00'02 %0L'02 % 02'9 e/u % 6E0L %09E % 08'S e/u e/u 6E paN-eM %L9'96 %09,9 e/u %00 S %8L'6 %98'9 09'EL 09 9 Bu 0'1 e/u Industry e/u inb3 Ainb3 e/u Equity Ainb3 e/u 99 %E8 0L %09't- 00 8 009 d8S Margin Margin Projected uouuo uouo od uo uunia wl-BuoT pajoofod SLOZ Trailing Projected Earnings Earnings Projected OLOZ Projected S1sed uo SeaA -6uon Projected OLOZ opey03d (Trailing 2015 (L0 E Aenuer uno sBuues Lo ea posy pajoefod pue aoud ays o102 ARnge uo poseq a sodip unduoo pajoafo (sbuwee O10Z 180s) sBuuee seuenb noy ised pue eoud eus o10z nugey un peseq ae sepdyanu Aueduroo Buye 6002npnou o, WN papeloud 6 6L 9L 8 6LL 9'EL 0'6 9LL 0'LL 02 8'8L 0 L 0'2 89 6'SL 6y JeeA-O 6A JEBA-S 9'EL SL z'6L 9'9L 2 89 9'9L 0 9 OL 9SL 29 6002 8002 O'8L 62L 0'8 6'EL z9k 08L 6 9 L'L 6EL O'L L002 9002 e/u 6'9 LLL 6'SL 8'6L 0'9h 85 O 9002 LLL L9L 9'22 002 8002 002 0'SL 9LL S'EL 0 LL 8L 6'92 892 8LL 9 0'02 Z002 WN 6 L002 0002 g'6L 09 29 WN 6'02 85 6'0L 9 12 666 866L L66L SLL 8 21 912 S'6L S'92 9E L02 6LL 62L 8'2 69 6L 966 S66 66 0'9 9LL 09 0'6L 02 6 02 6' LLL L'02 6SL 98 g6 soo Aewajes neodns Joboy 009 dS 9 1q14x3


