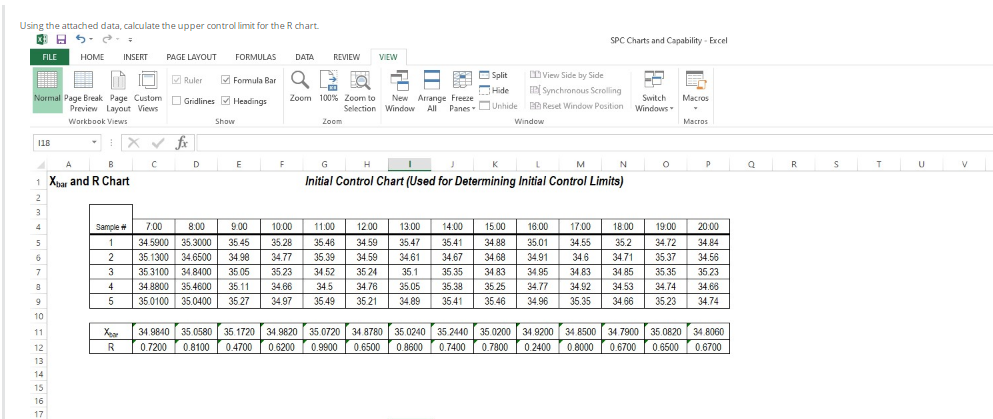
Question: Using the attached data, calculate the upper controllimit for the chart 5. SPC Charts and Capability Excel FILE HOME INSERT PAGE LAYOUT FORMULAS DATA REVIEW

Using the attached data, calculate the upper

Using the attached data, calculate the upper controllimit for the chart 5. SPC Charts and Capability Excel FILE HOME INSERT PAGE LAYOUT FORMULAS DATA REVIEW VIEW Ruler Formula Bar Split View Side by Side L -O Hide FP Synchronous Scrolling Normal Page Break Page Custom Gridlines Headings Zoom 100% Zoom to New Arrange Freeze Switch Macros Preview Layout Views Selection Window All Panes. Unhide Reset Window Position Reset Window Position Windows Workbook Views Show Zoom Window Macros 118 - IX fx D E F G H K 4 M N 0 Q B s T U V Initial Control Chart (Used for Determining Initial Control Limits) 11.00 19.00 A B 1 Xbar and R Chart 2 3 4 Sample 5 1 6 2 7 3 3 8 4 9 5 7.00 8.00 34 5900 35.3000 35.1300 34.6500 35 3100 34 8400 34.8800 35.4600 350100 35.0400 900 35.45 34.98 3505 35.11 35 27 10.00 35.28 34.77 3523 34.66 3497 35.48 35.39 34 52 345 35.49 12.00 34.59 34.59 3524 34.76 3521 13.00 35.47 34.61 351 35.05 34.89 14.00 35.41 34.67 35 35 35.38 35.41 1500 34.88 34.68 3483 35 25 35 46 18.00 35.01 34.91 3495 34.77 34,96 17.00 34.55 346 34 83 34.92 35.35 18.00 35.2 34.71 34 85 34.53 34.66 34.72 35.37 35 35 34.74 3523 20.00 34.84 34.56 35 23 34.88 34.74 10 11 Xer R 349840 35 0580 35 1720 31.9820 350720 34 8780 35 0240 35 2440 35 0200 31.9200 34 9200 34 8500 34 790035 082034 8060 0.7200 0.8100 0.4700 0.62000.99000.6500 0.8600 0.7400 0.7800 0.2400 0.8000 0.6700 0.6500 0.6700 12 13 14 15 16 17

Step by Step Solution

There are 3 Steps involved in it

1 Expert Approved Answer
Step: 1 Unlock blur-text-image
Question Has Been Solved by an Expert!

Get step-by-step solutions from verified subject matter experts

Step: 2 Unlock
Step: 3 Unlock

Students Have Also Explored These Related General Management Questions!