

Question: Using the attached image answer the following questions. Discuss the results and whether or not the results show a strong correlation or not. Discuss the
Using the attached image answer the following questions.
Discuss the results and whether or not the results show a strong correlation or not. Discuss the value of R and what it means? What is ideal? Is this a good fit? Also, give examples in the real world where linear regression would make sense? When is a linear model the ideal model? In these cases what would you expect the value of R to be?
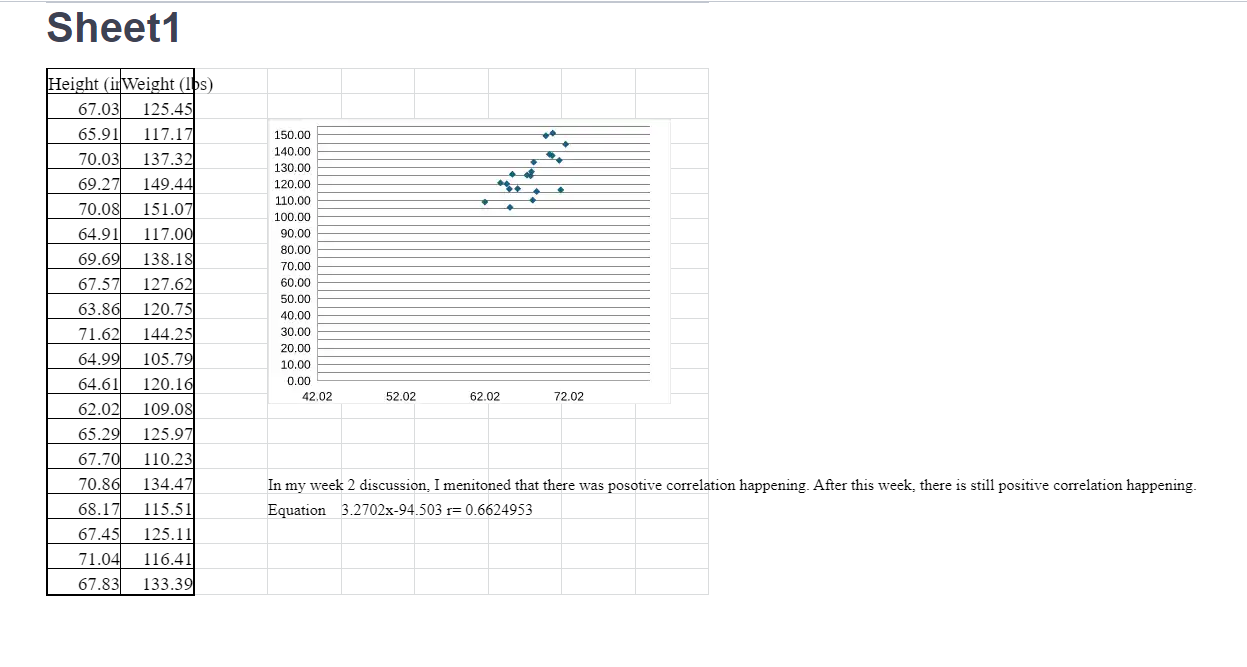
Sheet1 Height (inWeight (Ios) 67.03 125.45 65.91 117.17 150.00 70.03 137.32 140.00 130.00 69.27 149.44 120.00 70.08 151.07 110.00 100.00 64.91 117.00 90.00 80.00 69.69 138.18 70.00 67.57 127.62 60.00 50.00 63.86 120.75 40.00 71.62 144.25 30.00 20.00 64.99 105.79 10.00 64.61 120.16 0.00 42.02 52.02 62.02 72.02 62.02 109.08 65.29 125.97 67.70 110.23 70.86 134.47 In my week 2 discussion, I menitoned that there was posotive correlation happening. After this week, there is still positive correlation happening. 68.17 115.51 Equation 3.2702x-94.503 r= 0.6624953 67.45 125.11 71.04 116.41 67.83 133.39
Step by Step Solution
There are 3 Steps involved in it

Get step-by-step solutions from verified subject matter experts