

Question: QUESTION 2 In a consumer-preference study, a random sample of customers were asked to rate several attributes of a new product. The responses, on a
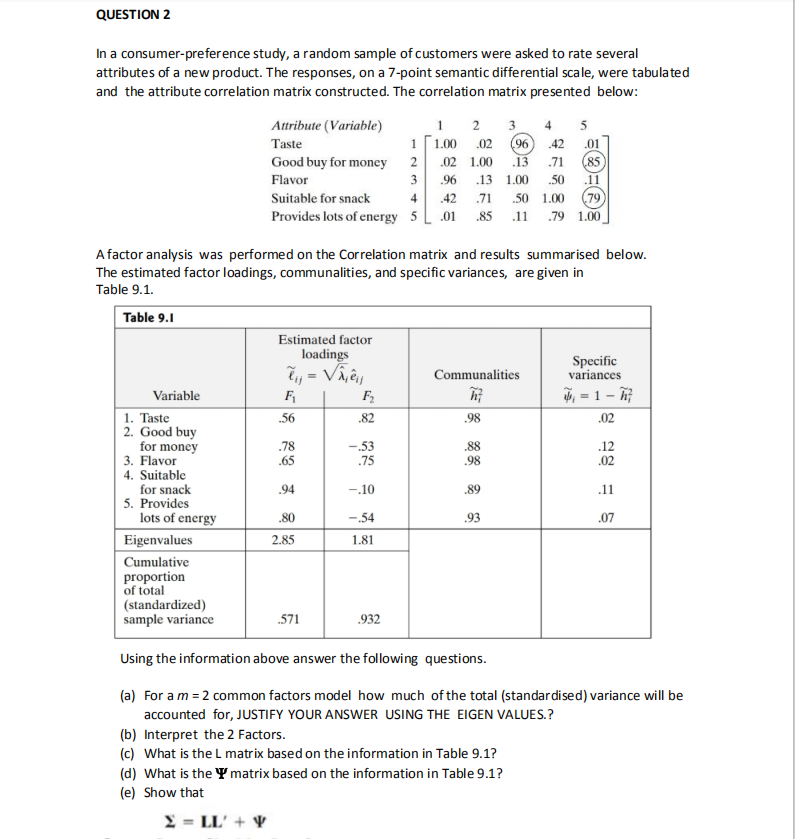
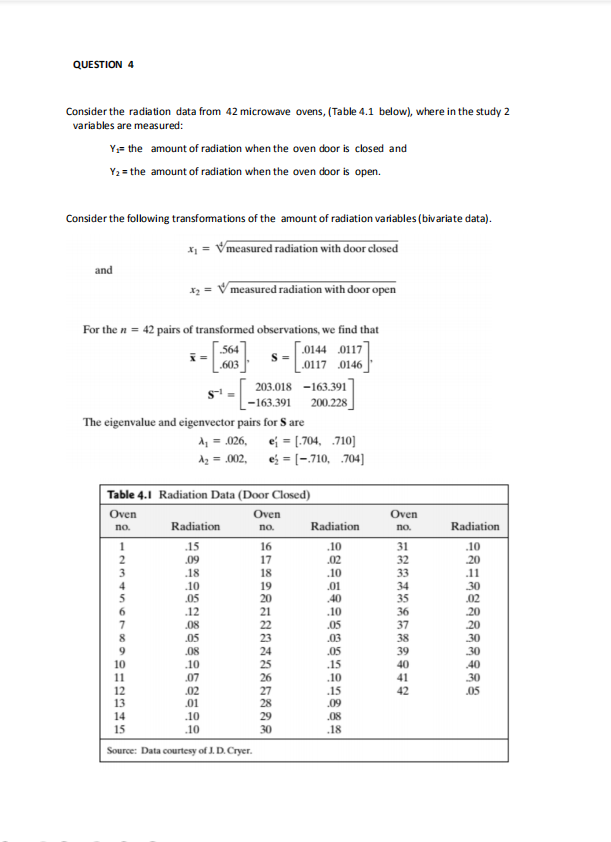
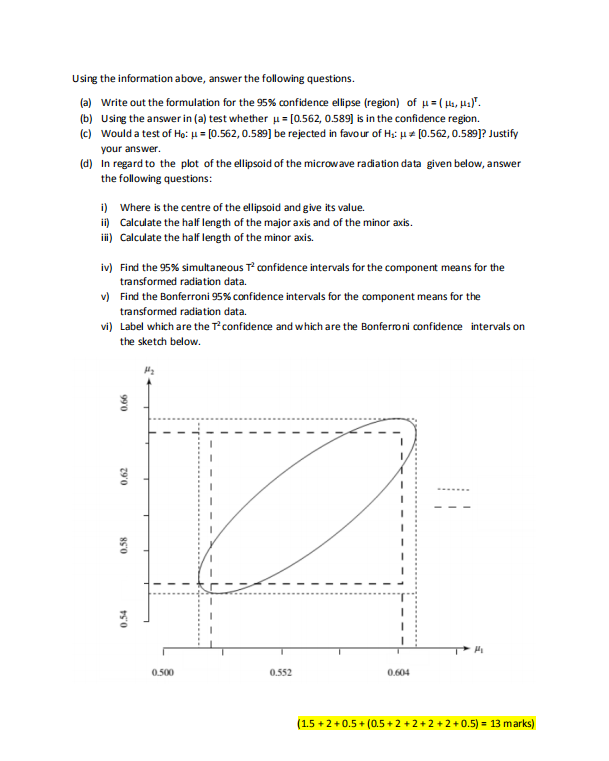
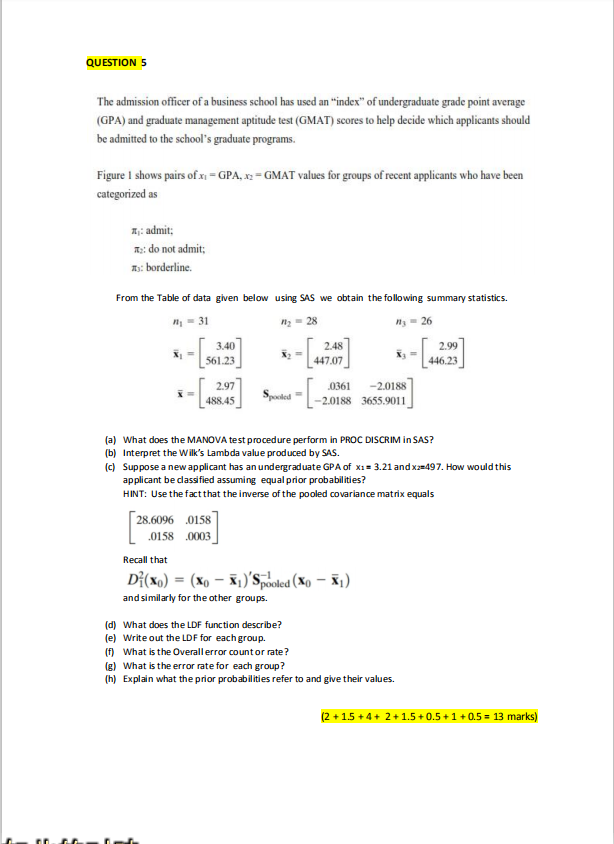
QUESTION 2 In a consumer-preference study, a random sample of customers were asked to rate several attributes of a new product. The responses, on a 7-point semantic differential scale, were tabulated and the attribute correlation matrix constructed. The correlation matrix presented below: Attribute (Variable) 2 Taste 1.00 .02 Good buy for money .02 1.00 .71 (85) Flavor .96 .13 1.00 .50 .11 Suitable for snack .42 .71 .50 1.00 (79 Provides lots of energy 5 01 85 .11 .79 1.00 A factor analysis was performed on the Correlation matrix and results summarised below. The estimated factor loadings, communalities, and specific variances, are given in Table 9.1. Table 9.1 Estimated factor loadings by = Vijey Specific Communalities variances Variable F2 4, = 1 - h; 1. Taste 56 .82 .98 .02 2. Good buy for money 78 -.53 88 .12 3. Flavor 65 75 98 02 4. Suitable for snack .94 -,10 89 .11 5. Provides lots of energy .80 -.54 .93 .07 Eigenvalues 2.85 1.81 Cumulative proportion of total (standardized) sample variance 571 .932 Using the information above answer the following questions. (a) For a m = 2 common factors model how much of the total (standardised) variance will be accounted for, JUSTIFY YOUR ANSWER USING THE EIGEN VALUES.? b) Interpret the 2 Factors. (c) What is the L matrix based on the information in Table 9.1? (d) What is the T' matrix based on the information in Table 9.1? (e) Show that Y = LL' +QUESTION 4 Consider the radiation data from 42 microwave ovens, (Table 4.1 below), where in the study 2 variables are measured: Yo= the amount of radiation when the oven door is closed and Ya = the amount of radiation when the oven door is open. Consider the following transformations of the amount of radiation variables (bivariate data). x1 = Vmeasured radiation with door closed and x2 = V measured radiation with door open For the n = 42 pairs of transformed observations, we find that i = 564 S = .0144 0117 .603 .0117 0146 203.018 -163.391 -163.391 200.228 The eigenvalue and eigenvector pairs for S are 1 = .026. e; = [.704. .710] Az = .002, es = [-.710, .704] Table 4.1 Radiation Data (Door Closed) Oven Oven Oven no. Radiation no. Radiation no. Radiation MESSESOX JO WAWNE 15 16 10 31 10 .09 17 .02 32 .18 18 .10 33 .10 19 .01 34 .05 20 .40 35 .12 .10 36 .08 22 .05 37 .05 10 Source: Data courtesy of J. D. Cryer.Using the information above, answer the following questions. (a) Write out the formulation for the 95% confidence ellipse (region) of u = ( s, Ha). (b) Using the answer in (a) test whether u = [0.562, 0.589] is in the confidence region (c) Would a test of Ho: A = [0.562, 0.589] be rejected in favour of Hi: u = [0.562, 0.589]? Justify your answer. (d) In regard to the plot of the ellipsoid of the microwave radiation data given below, answer the following questions: i) Where is the centre of the ellipsoid and give its value. i) Calculate the half length of the major axis and of the minor axis. ifi) Calculate the half length of the minor axis. iv) Find the 95% simultaneous T- confidence intervals for the component means for the transformed radiation data. Find the Bonferroni 95% confidence intervals for the component means for the transformed radiation data. vi) Label which are the T-confidence and which are the Bonferroni confidence intervals on the sketch below. 0.66 0,61 0.58 0.54 0.500 0.552 0.604 (1.5 + 2 +0.5+ (0.5+ 2 + 2 + 2 + 2 + 0.5) = 13 marks)QUESTION 5 The admission officer of a business school has used an "index" of undergraduate grade point average (GPA) and graduate management aptitude test (GMAT) scores to help decide which applicants should be admitted to the school's graduate programs. Figure I shows pairs of x1 = GPA. x2 = GMAT values for groups of recent applicants who have been categorized as I: admit: is: do not admit; my: borderline. From the Table of data given below using SAS we obtain the following summary statistics. 1 31 my = 28 My = 26 1 = 3.40 2.48 2.99 561.23 447.07 446.23 i = 2.97 Speeded = 0361 -2.0188 488.45 -20188 3655.9011 (a) What does the MANOVA test procedure perform in PROC DISCRIM in SAS? [b) Interpret the Wilk's Lambda value produced by SAS. (c) Suppose a new applicant has an undergraduate GPA of x1= 3.21 and x2=497. How would this applicant be classified assuming equal prior probabilities? HINT: Use the fact that the inverse of the pooled covariance matrix equals 28.6096 .0158 .0158 .0003 Recall that Di(Xo) = (X0 - X1)'Spdo Spooled (X0 - X1) and similarly for the other groups. (d) What does the LDF function describe? (e) Write out the LDF for each group. [f) What is the Overall error count or rate? g) What is the error rate for each group? [h) Explain what the prior probabilities refer to and give their values. (2 +15 +4+ 2+ 1.5 + 0.5 + 1 + 0.5 = 13 marks)
Step by Step Solution
There are 3 Steps involved in it

Get step-by-step solutions from verified subject matter experts