

Question: using the balance sheet and income statement information given, fill out the shaded areas to calculate financial ratios for this company, then answer the questions
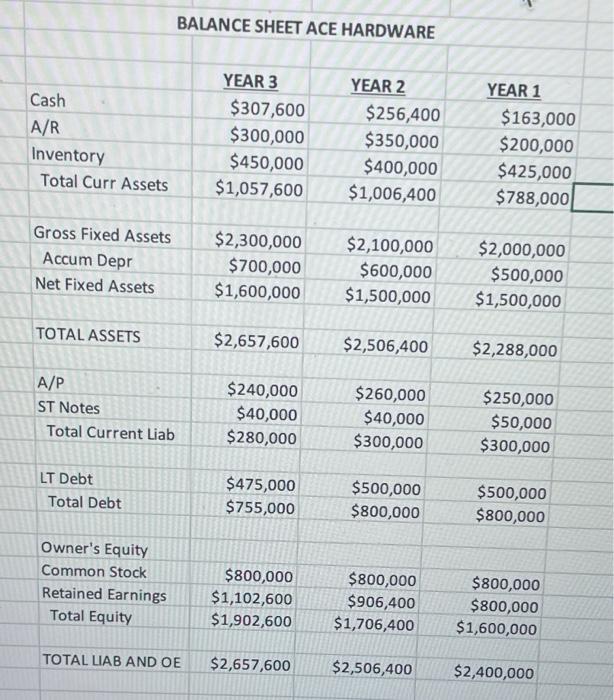
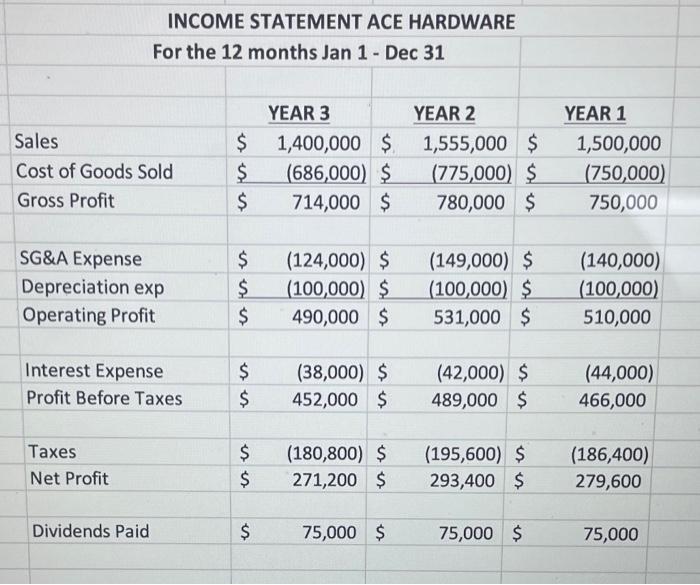
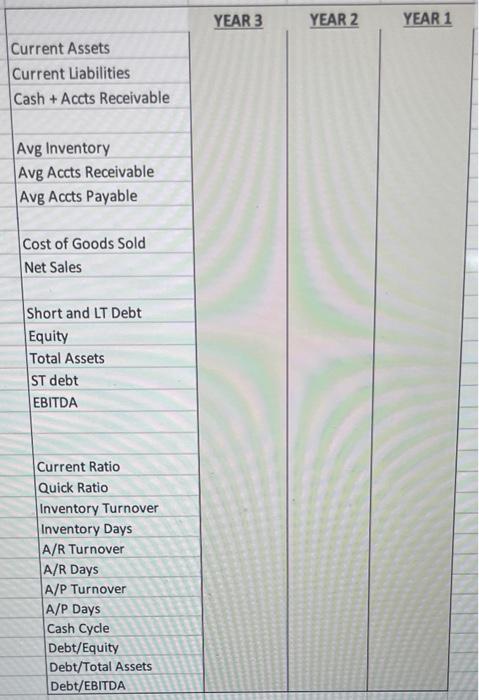
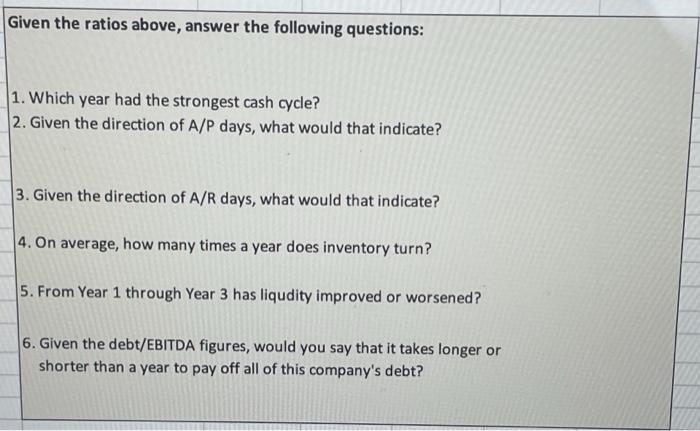
BALANCE SHEET ACE HARDWARE Cash A/R Inventory Total Curr Assets YEAR 3 $307,600 $300,000 $450,000 $1,057,600 YEAR 2 $256,400 $350,000 $400,000 $1,006,400 YEAR 1 $ 163,000 $200,000 $425,000 $788,000 Gross Fixed Assets Accum Depr Net Fixed Assets $2,300,000 $700,000 $1,600,000 $2,100,000 $600,000 $1,500,000 $2,000,000 $500,000 $1,500,000 TOTAL ASSETS $2,657,600 $2,506,400 $2,288,000 A/P ST Notes Total Current Liab $240,000 $40,000 $280,000 $260,000 $40,000 $300,000 $250,000 $50,000 $300,000 LT Debt Total Debt $475,000 $755,000 $500,000 $800,000 $500,000 $800,000 Owner's Equity Common Stock Retained Earnings Total Equity $800,000 $1,102,600 $1,902,600 $800,000 $906,400 $1,706,400 $800,000 $800,000 $1,600,000 TOTAL LIAB AND OE $2,657,600 $2,506,400 $2,400,000 INCOME STATEMENT ACE HARDWARE For the 12 months Jan 1 - Dec 31 Sales Cost of Goods Sold Gross Profit $ $ $ YEAR 3 1,400,000 $ (686,000) $ 714,000 $ YEAR 2 1,555,000 $ (775,000 $ 780,000 $ YEAR 1 1,500,000 (750,000) 750,000 SG&A Expense Depreciation exp Operating Profit $ $ $ $ (124,000) $ (100,000 $ 490,000 $ (149,000) $ (100,000) $ 531,000 $ (140,000) (100,000) 510,000 Interest Expense Profit Before Taxes $ $ (38,000) $ 452,000 $ (42,000) $ 489,000 $ (44,000) 466,000 Taxes Net Profit $ $ (180,800) $ 271,200 $ (195,600) $ 293,400 $ (186,400) 279,600 Dividends Paid $ 75,000 $ 75,000 $ 75,000 YEAR 3 YEAR 2 YEAR 1 Current Assets Current Liabilities Cash + Accts Receivable Avg Inventory Avg Accts Receivable Avg Accts Payable Cost of Goods Sold Net Sales Short and LT Debt Equity Total Assets ST debt EBITDA Current Ratio Quick Ratio Inventory Turnover Inventory Days A/R Turnover A/R Days A/P Turnover A/P Days Cash Cycle Debt/Equity Debt/Total Assets Debt/EBITDA Given the ratios above, answer the following questions: 1. Which year had the strongest cash cycle? 2. Given the direction of A/P days, what would that indicate? 3. Given the direction of A/R days, what would that indicate? 4. On average, how many times a year does inventory turn? 5. From Year 1 through Year 3 has liqudity improved or worsened? 6. Given the debt/EBITDA figures, would you say that it takes longer or shorter than a year to pay off all of this company's debt? BALANCE SHEET ACE HARDWARE Cash A/R Inventory Total Curr Assets YEAR 3 $307,600 $300,000 $450,000 $1,057,600 YEAR 2 $256,400 $350,000 $400,000 $1,006,400 YEAR 1 $ 163,000 $200,000 $425,000 $788,000 Gross Fixed Assets Accum Depr Net Fixed Assets $2,300,000 $700,000 $1,600,000 $2,100,000 $600,000 $1,500,000 $2,000,000 $500,000 $1,500,000 TOTAL ASSETS $2,657,600 $2,506,400 $2,288,000 A/P ST Notes Total Current Liab $240,000 $40,000 $280,000 $260,000 $40,000 $300,000 $250,000 $50,000 $300,000 LT Debt Total Debt $475,000 $755,000 $500,000 $800,000 $500,000 $800,000 Owner's Equity Common Stock Retained Earnings Total Equity $800,000 $1,102,600 $1,902,600 $800,000 $906,400 $1,706,400 $800,000 $800,000 $1,600,000 TOTAL LIAB AND OE $2,657,600 $2,506,400 $2,400,000 INCOME STATEMENT ACE HARDWARE For the 12 months Jan 1 - Dec 31 Sales Cost of Goods Sold Gross Profit $ $ $ YEAR 3 1,400,000 $ (686,000) $ 714,000 $ YEAR 2 1,555,000 $ (775,000 $ 780,000 $ YEAR 1 1,500,000 (750,000) 750,000 SG&A Expense Depreciation exp Operating Profit $ $ $ $ (124,000) $ (100,000 $ 490,000 $ (149,000) $ (100,000) $ 531,000 $ (140,000) (100,000) 510,000 Interest Expense Profit Before Taxes $ $ (38,000) $ 452,000 $ (42,000) $ 489,000 $ (44,000) 466,000 Taxes Net Profit $ $ (180,800) $ 271,200 $ (195,600) $ 293,400 $ (186,400) 279,600 Dividends Paid $ 75,000 $ 75,000 $ 75,000 YEAR 3 YEAR 2 YEAR 1 Current Assets Current Liabilities Cash + Accts Receivable Avg Inventory Avg Accts Receivable Avg Accts Payable Cost of Goods Sold Net Sales Short and LT Debt Equity Total Assets ST debt EBITDA Current Ratio Quick Ratio Inventory Turnover Inventory Days A/R Turnover A/R Days A/P Turnover A/P Days Cash Cycle Debt/Equity Debt/Total Assets Debt/EBITDA Given the ratios above, answer the following questions: 1. Which year had the strongest cash cycle? 2. Given the direction of A/P days, what would that indicate? 3. Given the direction of A/R days, what would that indicate? 4. On average, how many times a year does inventory turn? 5. From Year 1 through Year 3 has liqudity improved or worsened? 6. Given the debt/EBITDA figures, would you say that it takes longer or shorter than a year to pay off all of this company's debt
Step by Step Solution
There are 3 Steps involved in it

Get step-by-step solutions from verified subject matter experts